In a previous post, Reducing Voice Agent Latency with Parallel SLMs and LLMs, we showed how to reduce response times and create more natural conversational experiences using the LiveKit Agents framework. But optimization is only half the equation. Once your voice agents are deployed and handling real conversations, you need comprehensive monitoring to measure latency, track costs, and ensure optimal performance.
Voice AI agents present unique observability challenges. Real-time audio processing, variable LLM latency, and unpredictable token consumption create complex performance patterns that traditional application monitoring can’t capture effectively. Without proper metrics, it’s nearly impossible to identify whether slowdowns originate from your STT service, LLM provider, TTS processing, or network conditions.
While we have talked about some AI specific tools that could be used (more about that here: How to Automate Voice AI Agent Testing & Evaluation with Coval – WebRTC.ventures). In this guide, we’ll show how to build a complete observability stack for monitoring voice AI performance for LiveKit Agents using Prometheus monitoring and alerting solution and Grafana data visualization and dashboarding platform.
Voice AI Monitoring Challenges
Voice AI agents operate in a fundamentally different environment than traditional web applications or APIs. The real-time nature of conversational AI creates monitoring blind spots that standard application performance tools simply can’t address. Unlike stateless HTTP requests, voice interactions involve continuous audio streams, unpredictable user speech patterns, and complex multi-service orchestration where a single conversation touches STT, LLM, and TTS providers simultaneously.
These unique characteristics create several critical monitoring challenges:
- Audio flows in real-time
- LLMs add variable latency
- Costs can spiral if you’re not careful
Without solid metrics, you’re blind to:
- Why a bot feels “slow”
- Which conversations cost the most
- Whether your STT, LLM or TTS service is the bottleneck
- How can I compare different providers?
Prometheus + Grafana Setup Guide
While we at WebRTC.ventures build real-time voice AI agents and conversational applications using LiveKit Agents, Deepgram, OpenAI, Groq, and other leading platforms, we’ve found LiveKit to be particularly popular for voice agent implementations.
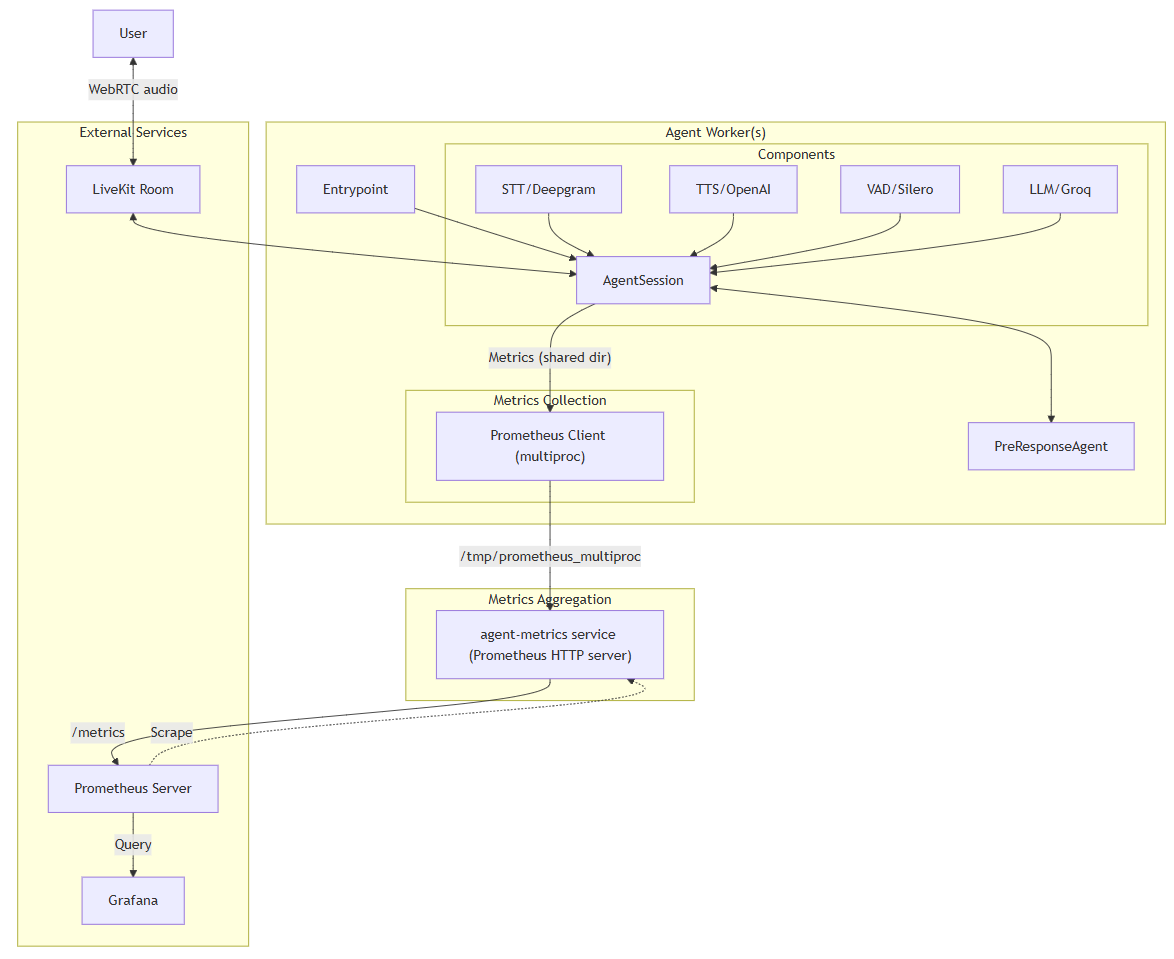
Having built and monitored voice agents multiple times with this stack, we developed a basic lightweight monitoring setup based on:
- A LiveKit Agent Worker that writes metrics locally using the metrics module
- An Agent Metrics service that exposes them
- Prometheus scrapes them continuously
- Grafana dashboards visualize trends and anomalies
You get real-time insights into:
- End-to-end latency (STT → LLM → TTS)
- Token and character usage
- Cost per interaction
- Active sessions and total conversation turns
Essential Metrics for Voice Agents
Effective voice AI monitoring requires tracking metrics that directly correlate with user experience and operational costs. Unlike traditional web applications where response time and error rates tell the full story, voice agents demand granular visibility into each component of the conversational pipeline.
Here are the essential metrics that provide actionable insights into voice agent performance:
- LLM sluggishness: Watch
livekit_llm_duration_ms, which comes from a LiveKit Agent LLMMetrics event that includes the time that it took for the LLM to generate the first token of the completion. For example, an average of above 1000ms indicates workload saturation or using the wrong model or LLM provider with slow Time To First Token (TTFT) for the voice agent use case. - Slow End of Utterance or STT: Look for jumps in
livekit_eou_delay_ms. This value is updated from the EOUMetrics. EOUMetrics is emitted when the user is determined to have finished speaking. It includes metrics related to end-of-turn detection and transcription latency. Tweak VAD (Voice Activity Detection) parameters to improve early detection and reduce partial result delays. - Cost spikes: Correlate LLM token growth (
livekit_total_tokens_total) against the value of the session. Implement response length constraints and summarization to manage spend. - Loops or stalls: Track
livekit_conversation_turns_totalover time. Sessions exceeding ~20-30 turns often indicate repeated queries or stuck logic. Depending on your use case, turns might be much lower than than.
Demo: Monitoring a Voice Agent Parallel LLM
Performance Optimization Results
In this GitHub repository webrtc-agent-livekit, we implemented this observability stack to monitor live AI agent conversations end to end.
Results from a production deployment:
- Latency Reduction: Reduced end-to-end latency from ~2 seconds to ~1.1 seconds by switching from GPT-4 to Groq LLaMA 3 and optimizing prompt construction. We also applied some other optimizations like the ones described in our blog post on parallel SLMs and LLMs.
- Cost Transparency: Identified that TTS accounted for ~50% of per-session costs in some workloads. Especially with standard verbose AI agents.
- Operational Alerts (Recommended): We suggest adding Prometheus rules to trigger alerts when, for example:
- LLM latency as Time To First Token (TTFT) exceeds 800ms
- Conversation turns exceed 30
More about this in my upcoming talk at the 2025 ClueCon Conference! A Recipe for Real Time Voice AI: WebRTC, SLMs and Open Source Software
Ready to Monitor and Optimize Your Voice Agents?
If you’re building voice or video applications and need help monitoring, scaling, or simply making them faster, we’re here for you. At WebRTC.ventures, we specialize in real-time communication platforms and are proud to be a trusted LiveKit development partner.
Want to dive deeper into performance metrics, reduce latency, or get better observability across your stack? WebRTC.ventures can help you build smarter, faster, and more reliable real-time experiences. Let’s talk!
We’ve also recently taken over stewardship of Peermetrics, a self-hosted solution to monitor all your WebRTC applications! Peermetrics offers fully open source client SDKs, back-ends and dashboards to troubleshoot issues, optimize performance, and deliver better user experiences. Visit peermetrics.io.

Further Reading:


