The webrtc-internals tab is a powerful debugging tool built into Chrome and other Chromium-based browsers. It provides real-time insights into active WebRTC sessions, offering developers a detailed view of connection behavior and media transport.
In this post, we’ll take a quick tour of how webrtc-internals enables real-time insights into active WebRTC sessions, helping developers analyze and debug connection behavior, media transport, and performance metrics. We’ll also explain why a different approach may be required for production environments.
Further reading: Troubleshooting WebRTC Applications: Essential Tools & Techniques
How Does webrtc-internals Work?
webrtc-internals is a special location that shows real-time traces and statistics of active WebRTC sessions. It can be accessed by writing chrome://webrtc-internals in the URL bar of the browser.
It registers calls to internal callbacks of key WebRTC events, and gathers connection’s statistics and metrics using the getStats API.
This tool is not only useful to understand how WebRTC applications work under the hood, it’s one of the first lines of defense for troubleshooting these when things are not working properly.
Understanding webrtc-internals
To get the most out of webrtc-internals, you need to open it prior to starting the WebRTC session you’re interested in monitoring. At first, it will look empty but it will start getting populated as you start the session.
The tool divides into two parts:
getUserMediatraces: it shows calls to the getUserMedia API performed in the current browser.RTCPeerConnectiontabs: it shows information about individual RTCPeerConnections established by the browser, each one on its own sub-tab.
Let’s see these in action through an example.
A Simple Peer Connection Example Under the Hood
In your Chrome browser, go to chrome://webrtc-internals in one tab, and open the basic peer connection demo in a single tab sample from WebRTC samples in another one. When you’re ready for the magic, press Start, and then Call. Make sure to accept any prompt that asks permissions for camera and microphone.
Your webrtc-internals tab will look something like this:
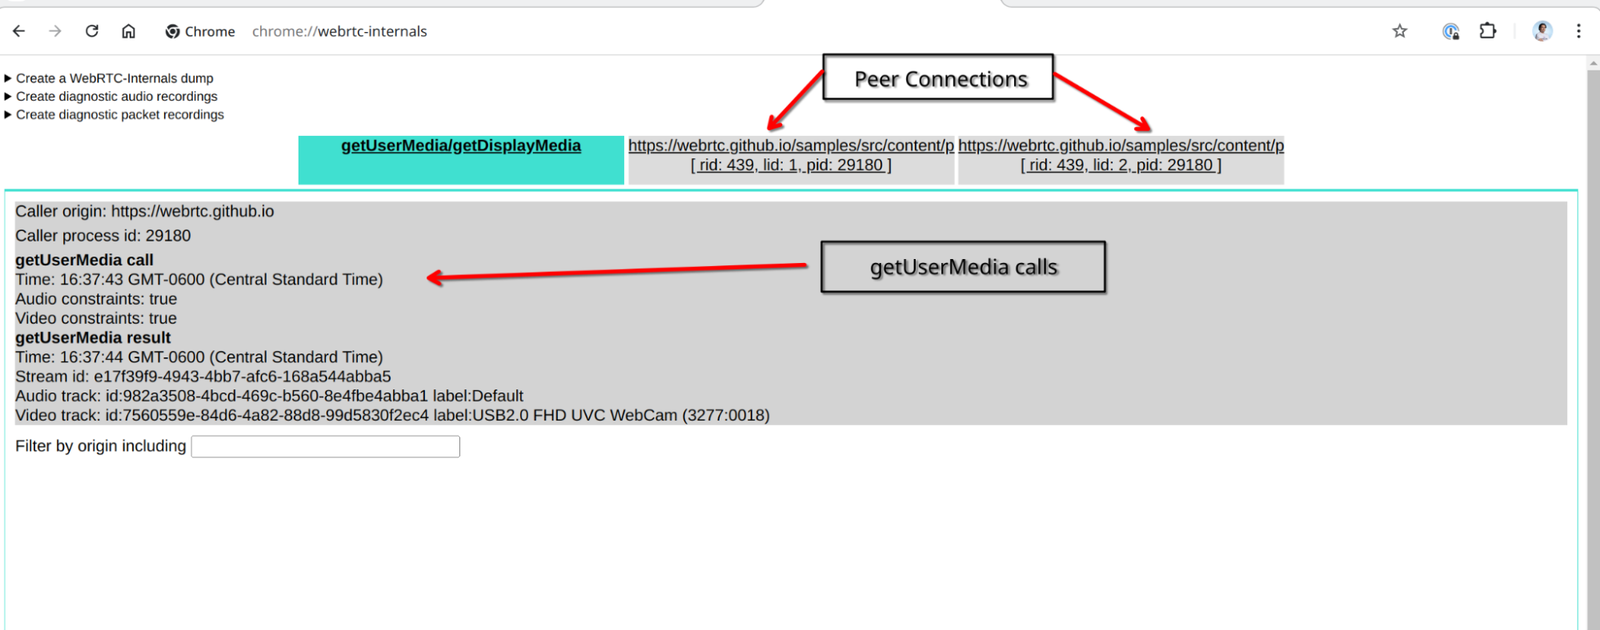
At the front you get the calls to getUserMedia API. In this case you can see that it was called with both audio and video constraints set to true. This resulted in IDs for the stream and audio/video tracks, along with the label of the media device from which the stream was captured.
You can also see two separate tabs for the peer connections that were established in this example. Let’s give a more in depth look at each of these.
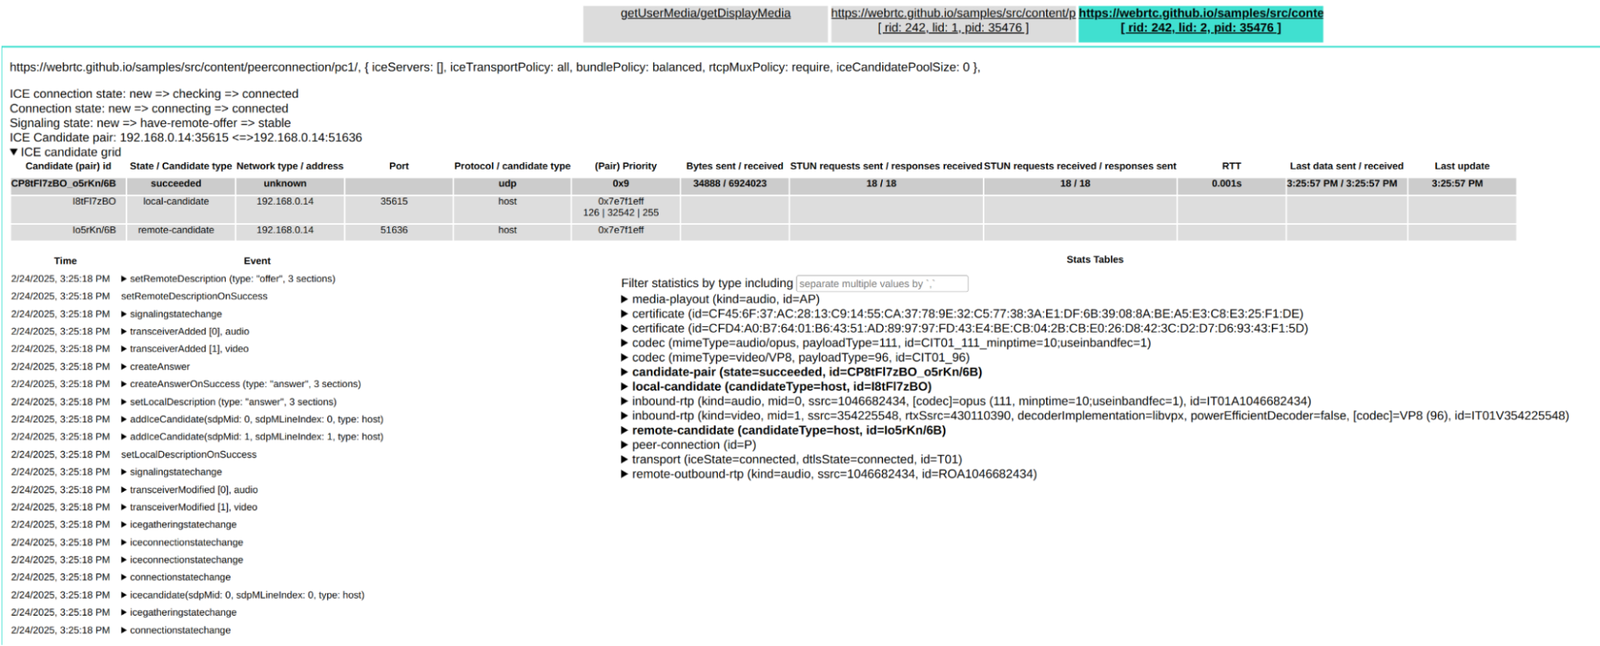
Start by clicking the first of the two, which displays the information of the first peer connection. Depending on the size of your screen, it could look similar to the image below.
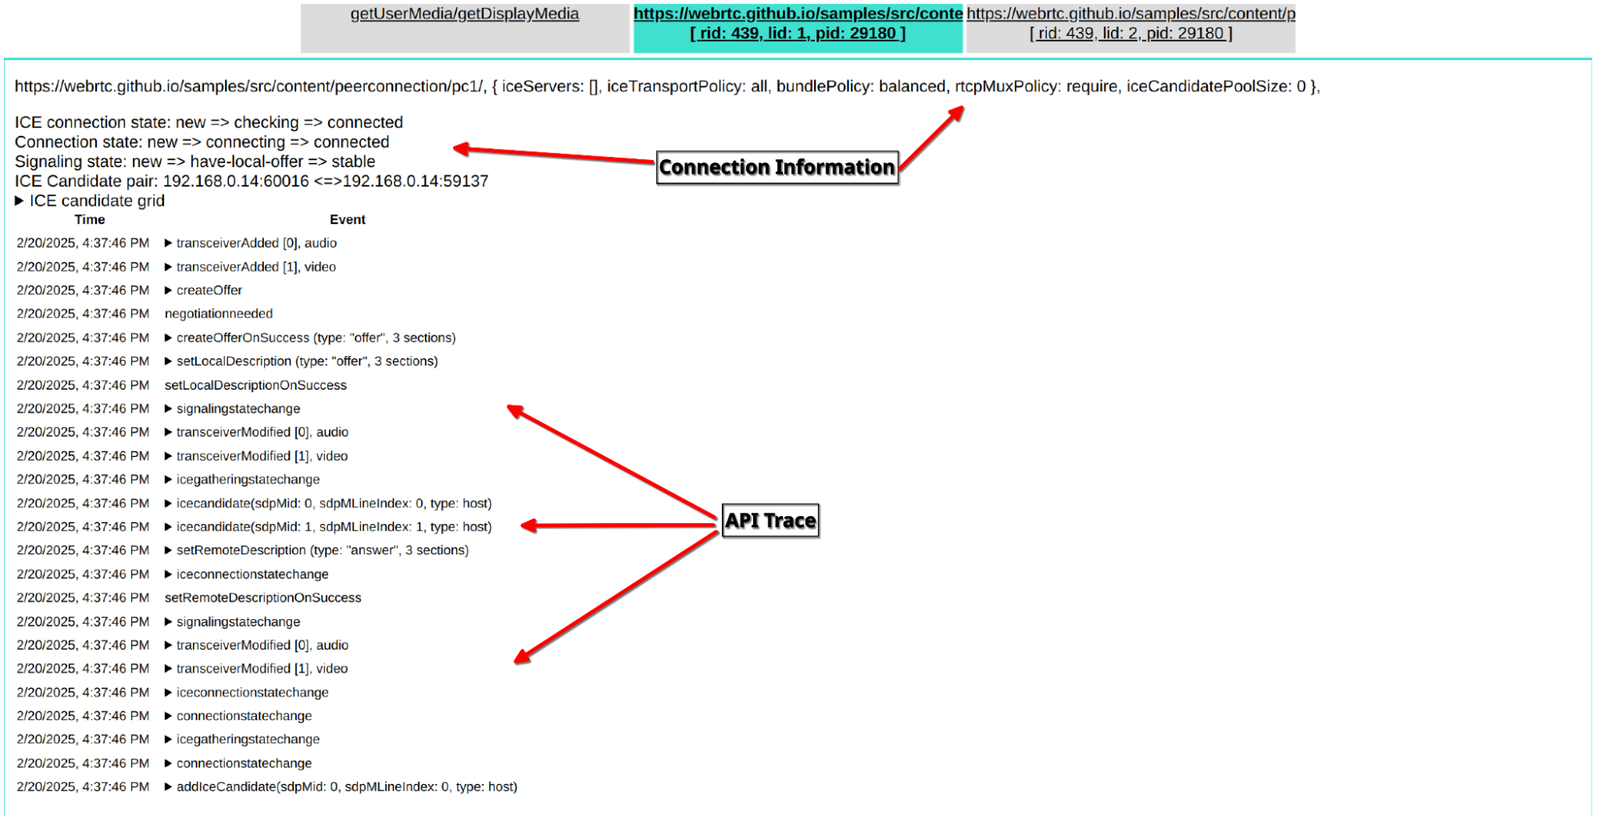
In the upper part we see information about the connection, and below we see the trace of API events that took place during the call. If you have a bigger screen than mine, you could also see the list of stats & metrics reports at the right, and graphs based on these at the bottom. We will take a look at these other sections later.
For now let’s dig into connection information and API trace one by one.
Connection Information
In the first line we see the URL of the application that the connection belongs to. Next, we see an object that lists multiple connection properties such as the ICE servers used for the connection, the configuration for some policies, and the ICE candidates pool size. One interesting thing about this application is that it doesn’t use ICE servers (iceServer is set to an empty array). For this sample this is fine, we will see why in a moment, but in a real-world application you’d want to have such servers in order for it to work in all network environments.
Following along, we can see the state of the connection to ICE servers (ICE connection state), the connection to the other peer (Connection state) and connection to the signaling server (Signaling state). We can also see the previous statuses for each type of connection.
Below is the ICE candidate pair selected for the peer connection, with the local peer at the left (192.168.0.4:51636), and the remote one at the right (192.168.0.4:35615). As you can see, in this sample application both peers are located in the same host but use a different port, hence it works without ICE servers.
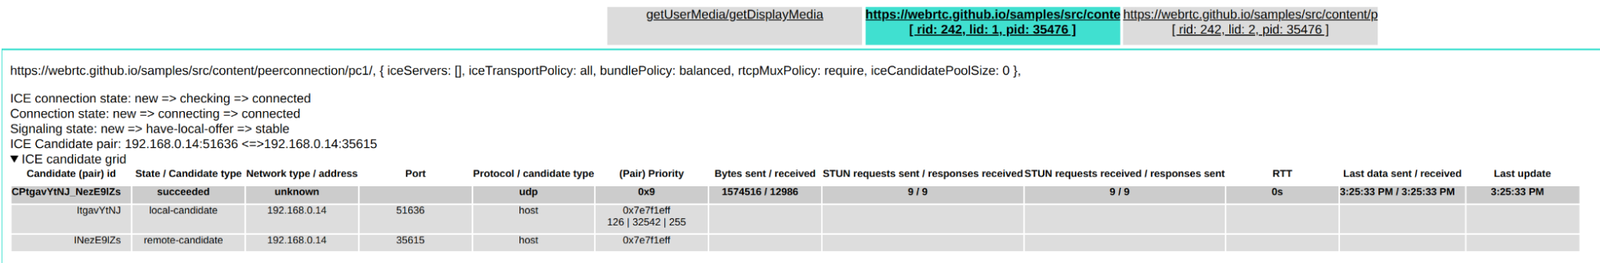
Finally, we also see an ICE candidate grid entry that can be expanded to show all the available peers that were tested. In this particular case only one pair was tested.
Now let’s take a look at some of the most important events at API trace.
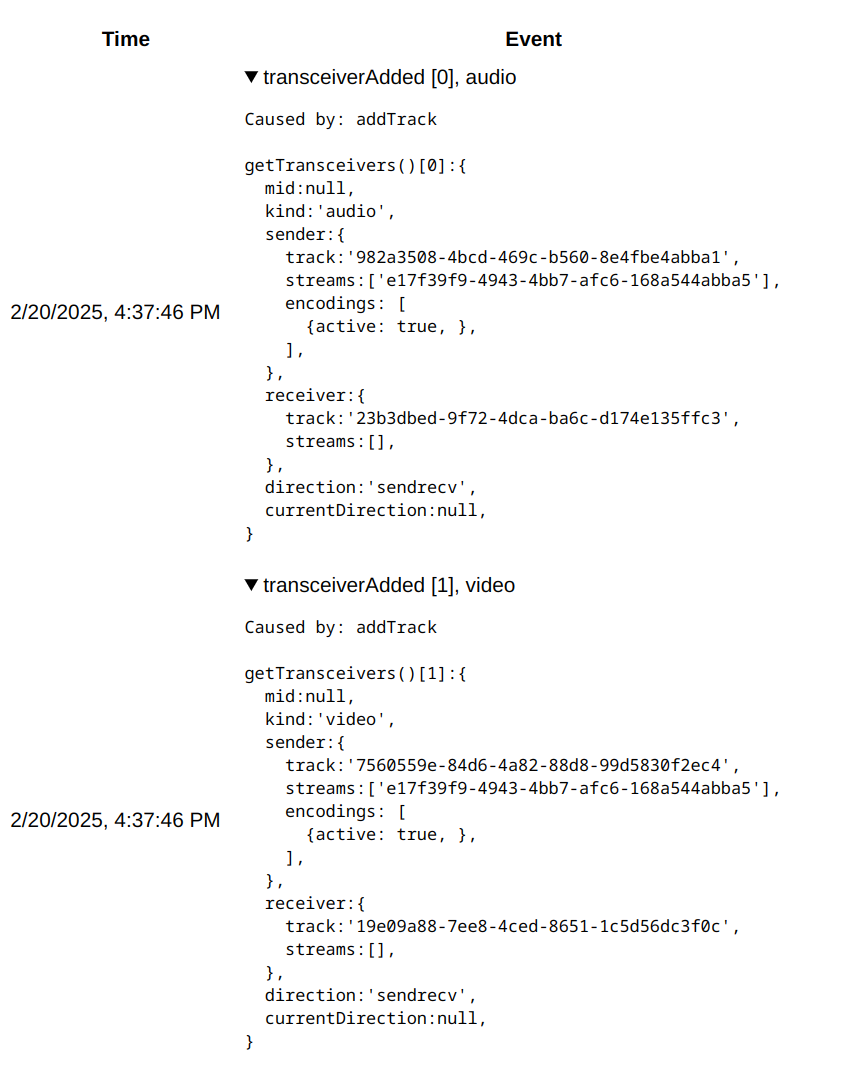
The first two tell us that we have transceivers for both video and audio. In other words, the application was able to get audio and video streams. This correlates with the call to getUserMedia we saw before, where both video and audio constraints were set to true.
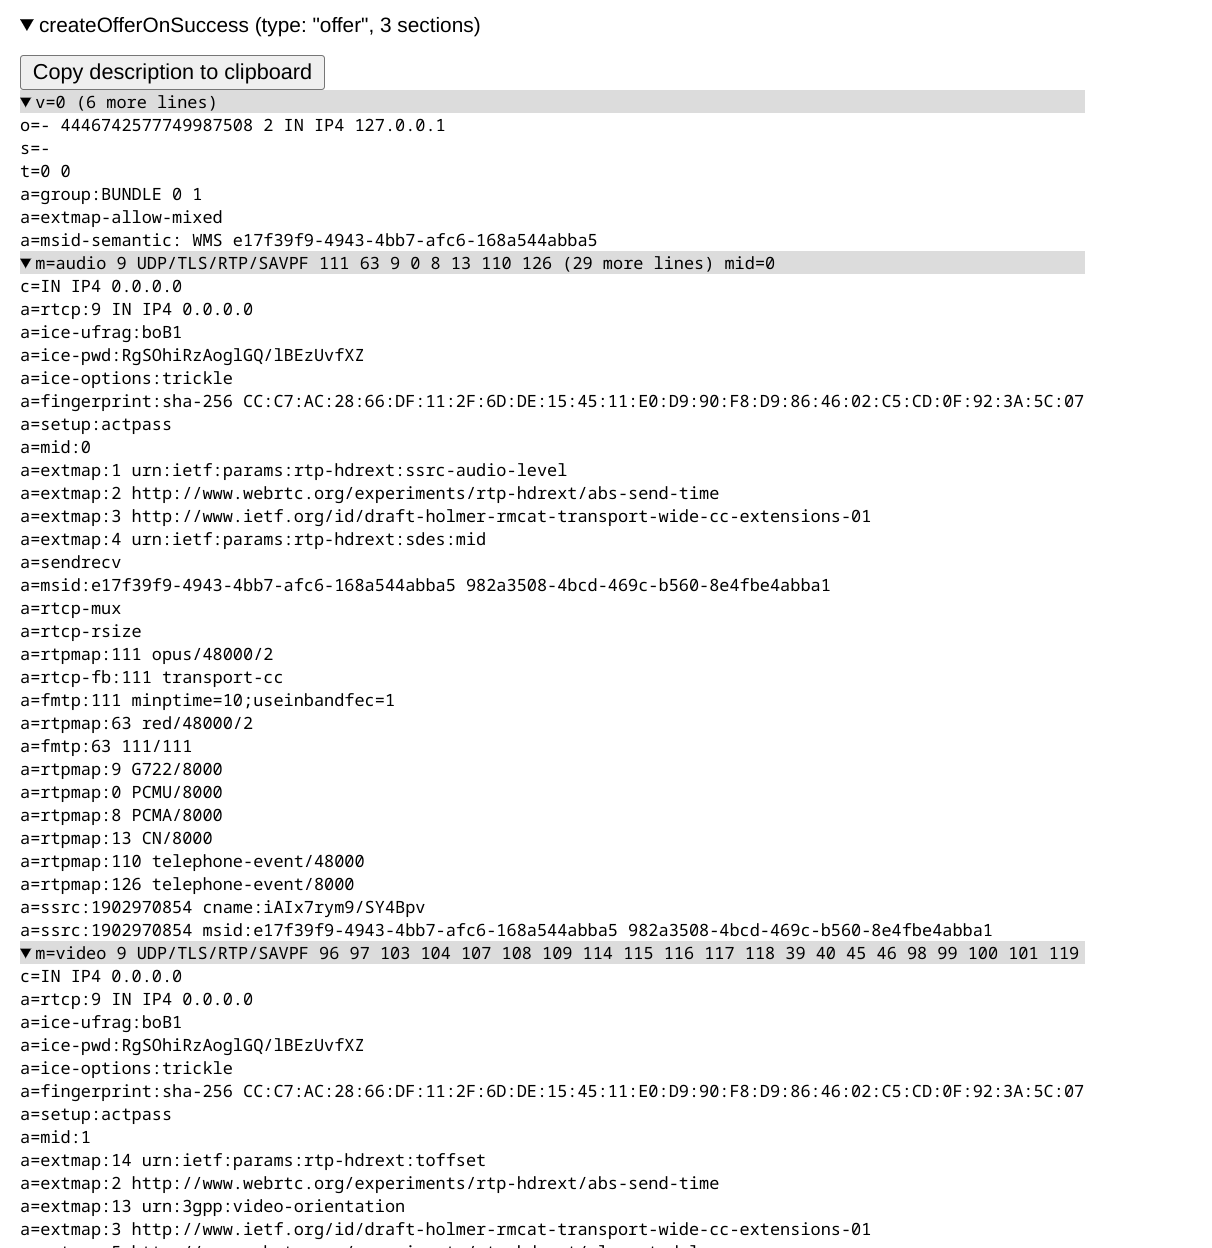
Another relevant event is the creation of the offer, registered as two steps:
- The call to
createOffer - The trigger of the
createOfferOnSuccessevent, which is where the Offer is finally available.
If you expand over the latter you can see the whole Offer in SDP format. This is useful to understand how the peer negotiates the connection.
If you continue through the steps, you’ll see updates on the state of important events such as the gathering of ICE candidates (icegatheringstatechange), and the local peer’s available candidates as icecandidate events.
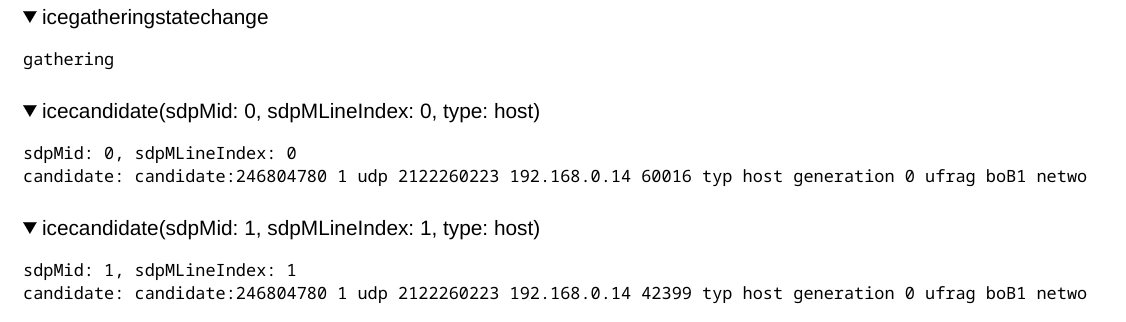
Let’s stop for a moment to understand something about these candidates. Note how these are host types. These are a type of candidate that the peer is able to obtain by itself, and are usually local/private IP addresses, however these are only useful when both peers are within the same local network, or as in this case, in the same host.
For scenarios where peers are in different networks, applications require ICE servers, which provide candidates of type srflx and relay. These candidates provide the ability for peers to overcome NAT limitations.
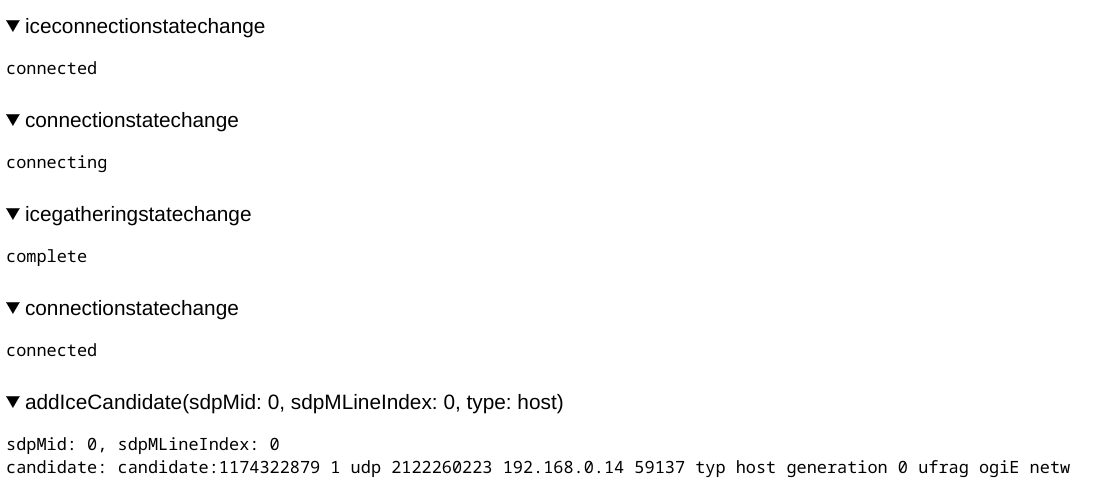
Following with events in API trace, you will see updates for other events such as the state of the ICE connection and of the peer connection itself. The API trace also shows the ICE candidates received from the other peer as addIceCandidate events.
Now let’s see how things look from the perspective of the other peer by clicking the other sub-tab.
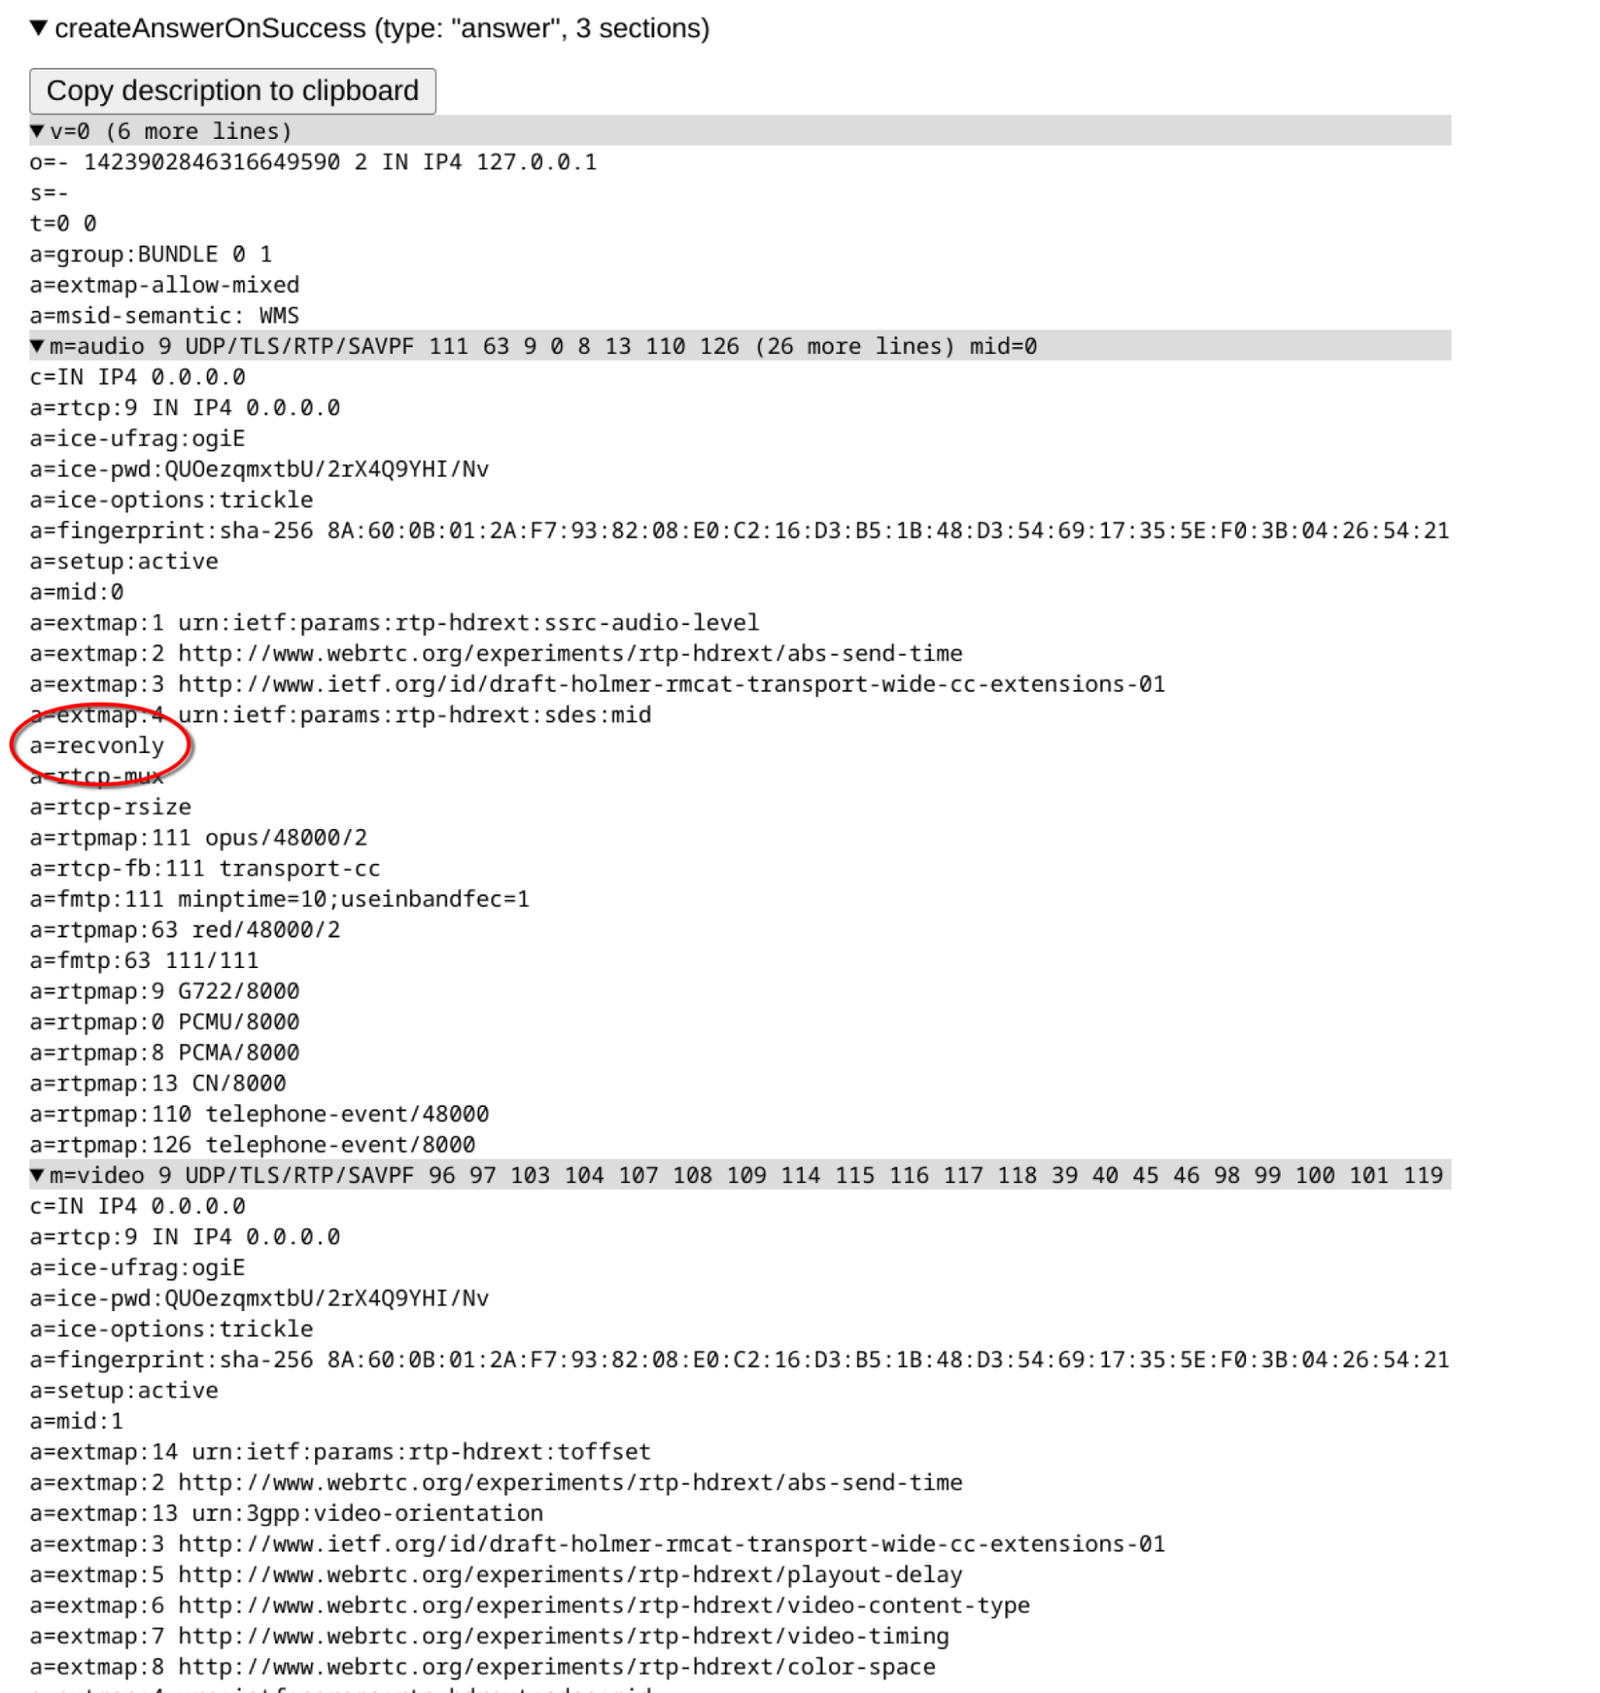
The connection information looks similar to the previous one, except that now local and remote peer candidates are swapped in the ICE Candidate pair section. We also see that API trace is slightly different, for example, now an Answer is created instead of an Offer.
If you expand on createAnswerOnSuccess you’ll see the Answer in SDP format. Note that in media configuration, this peer is configured to only receive such media (recvonly), while the other peer was configured to send and receive (sendrecv).
Stats & Metrics Reports
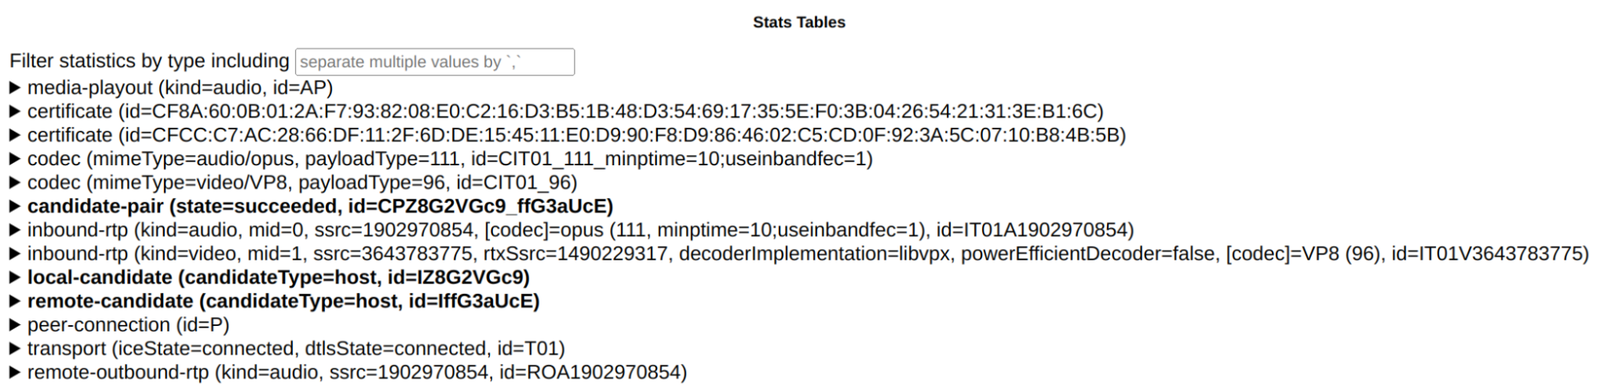
While we’re looking at this other peer, let’s also look at the stats & metrics reports. Depending on the size of your screen, these would be available at the right, or below API trace.
Such reports include information about the connection between candidates (candidate-pair report), the media that the peer is receiving (inbound-rtp reports for video and audio) and information about the candidates themselves (local-candidate and remote-candidate reports).
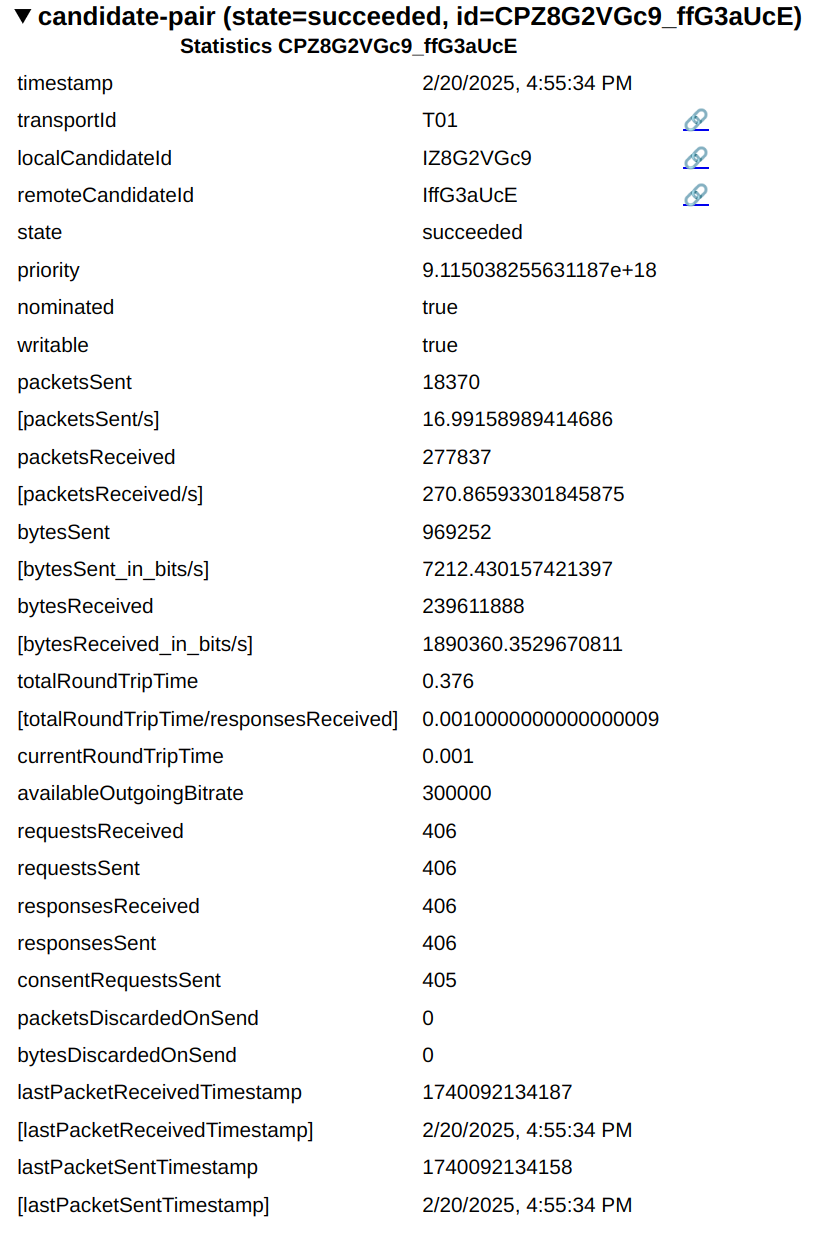
In the candidate pair report you can see statistics about the connection such as the amount of packets and bytes sent and received, the total and current round trip time, and timestamps from the last packet received and sent. All this from the perspective of the current peer.
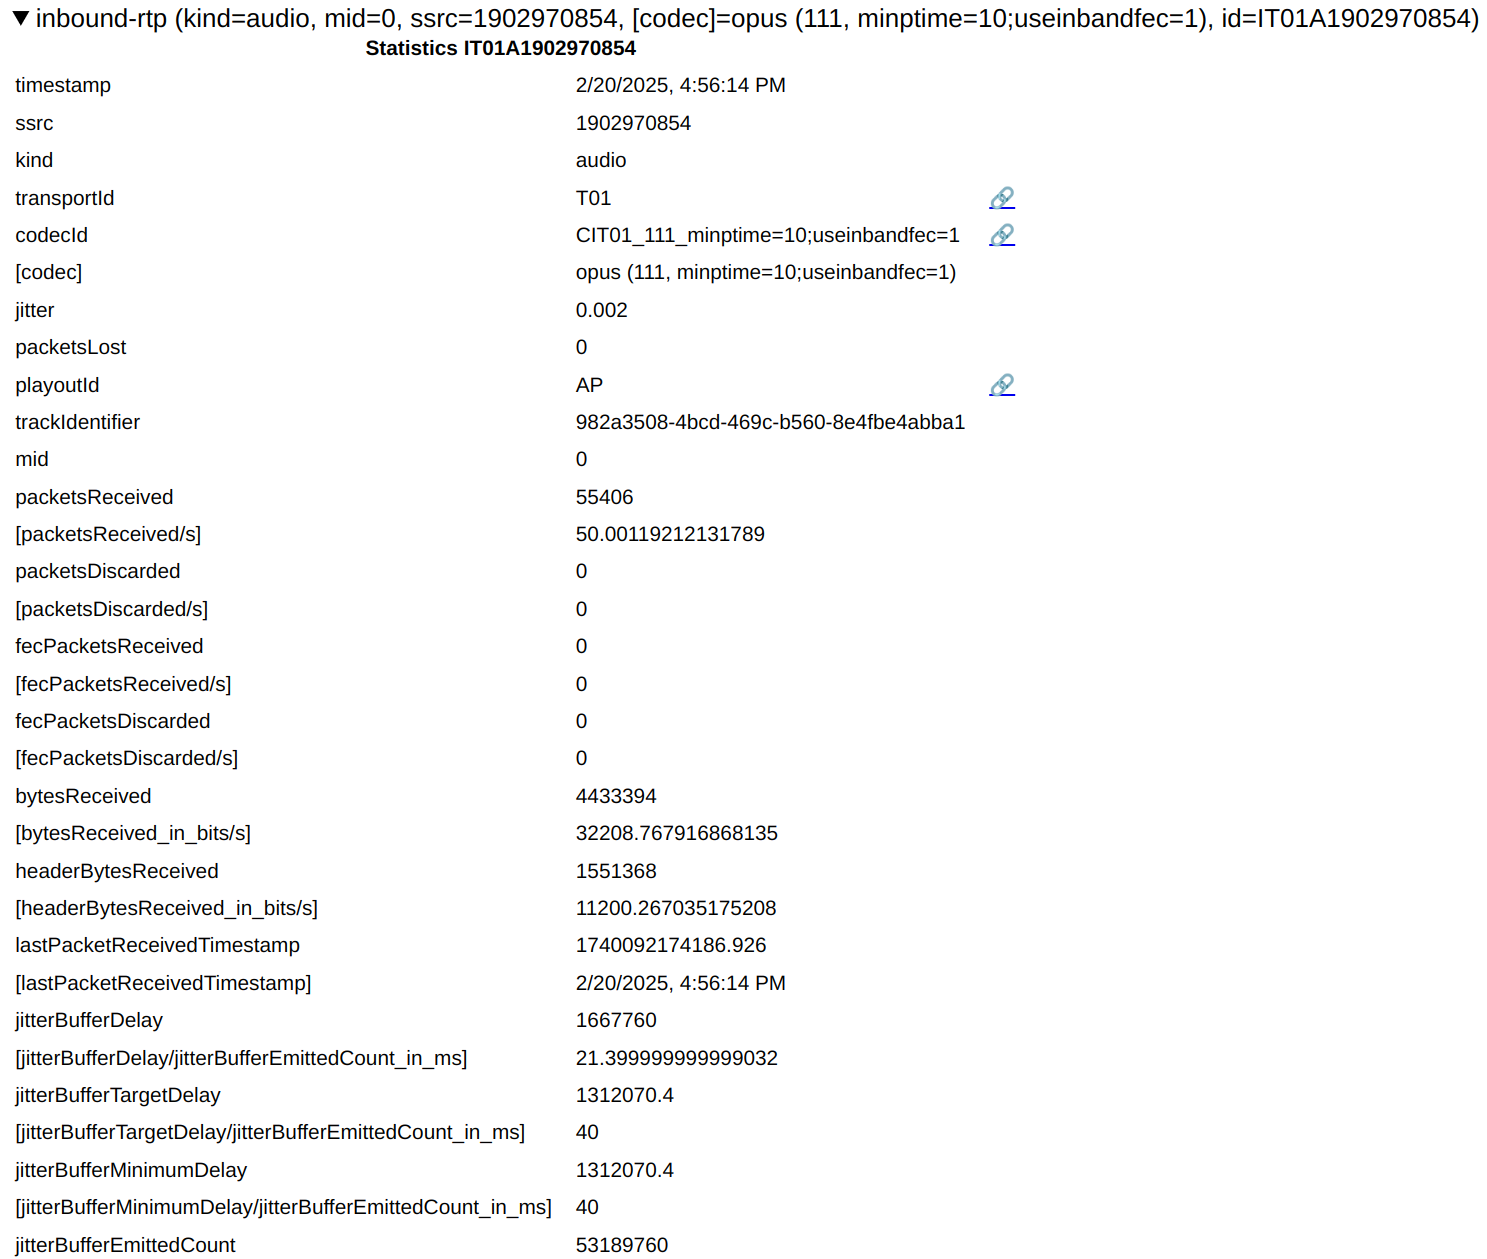
The media that the peer receives is provided in two individual reports: one for audio and another one for video.
The audio one shows information such as the codec used, the number of packets received and discarded, the amount of bytes received, and more.
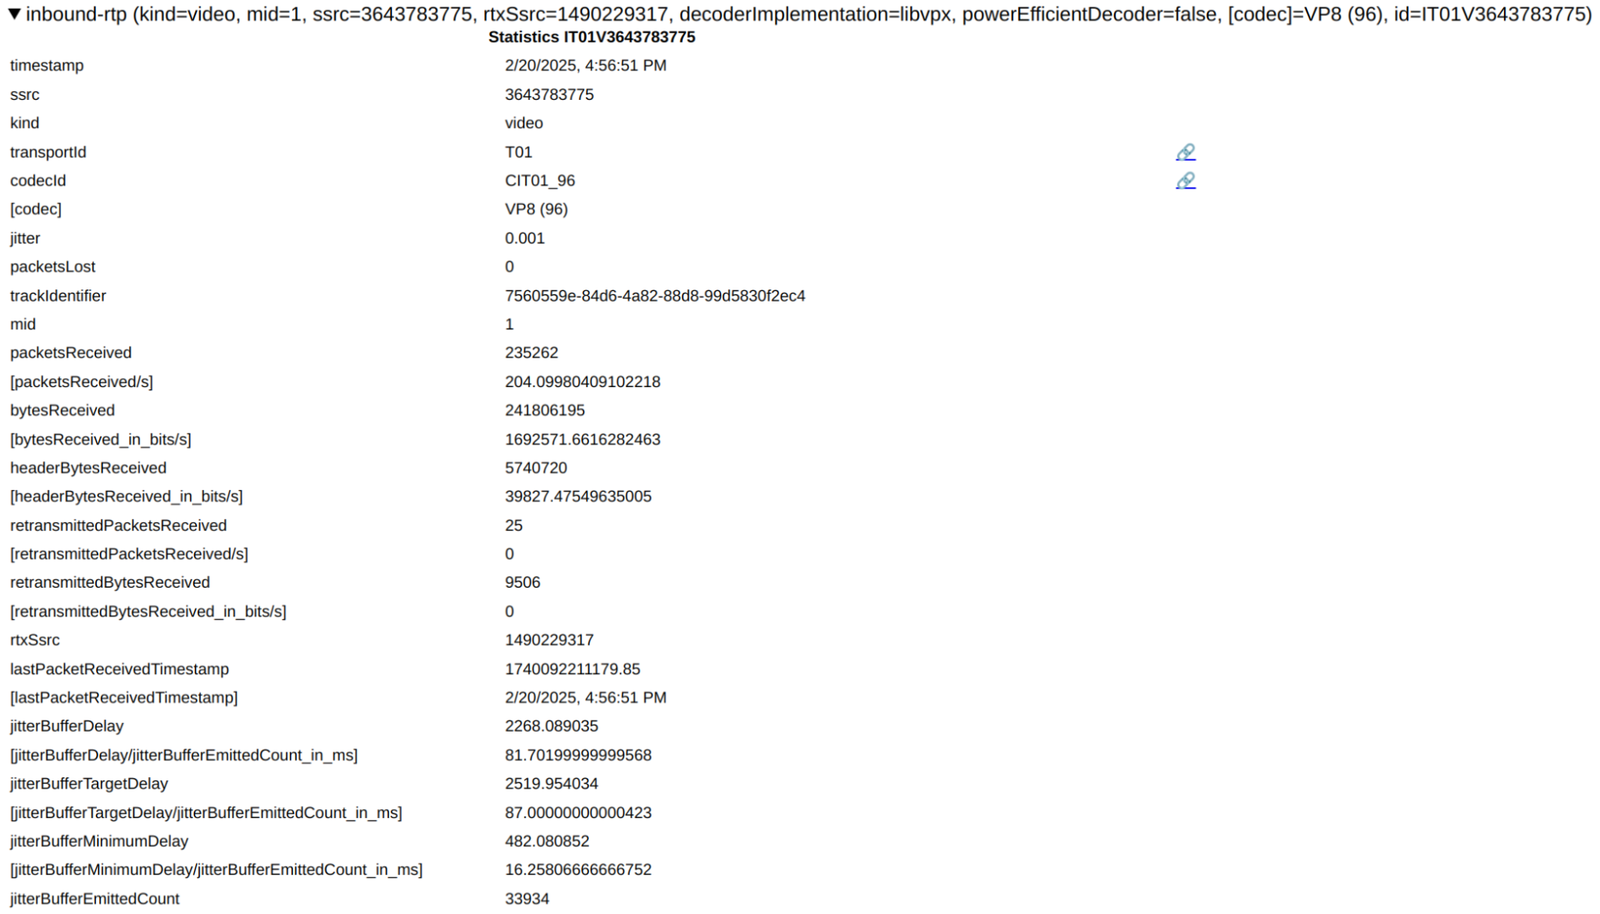
The video one shows similar information plus video-related data such as frame rate, actual frames received and dropped, resolution and more.
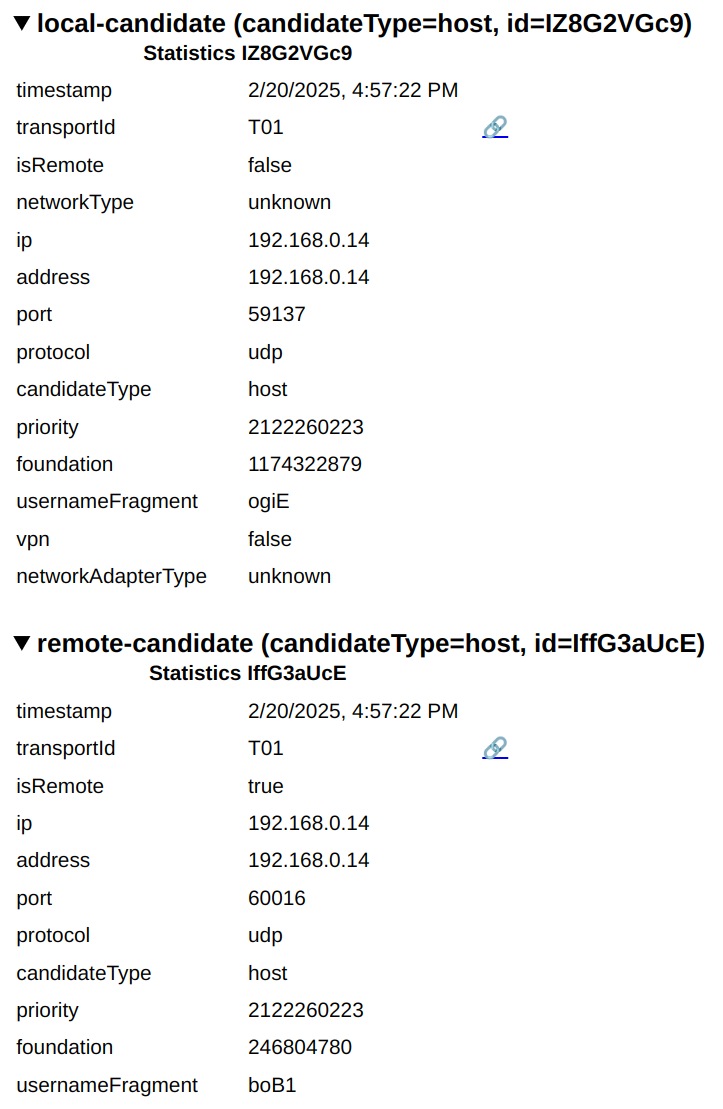
In the candidates reports you can see information such as the IP address, port, type of candidate and protocol.
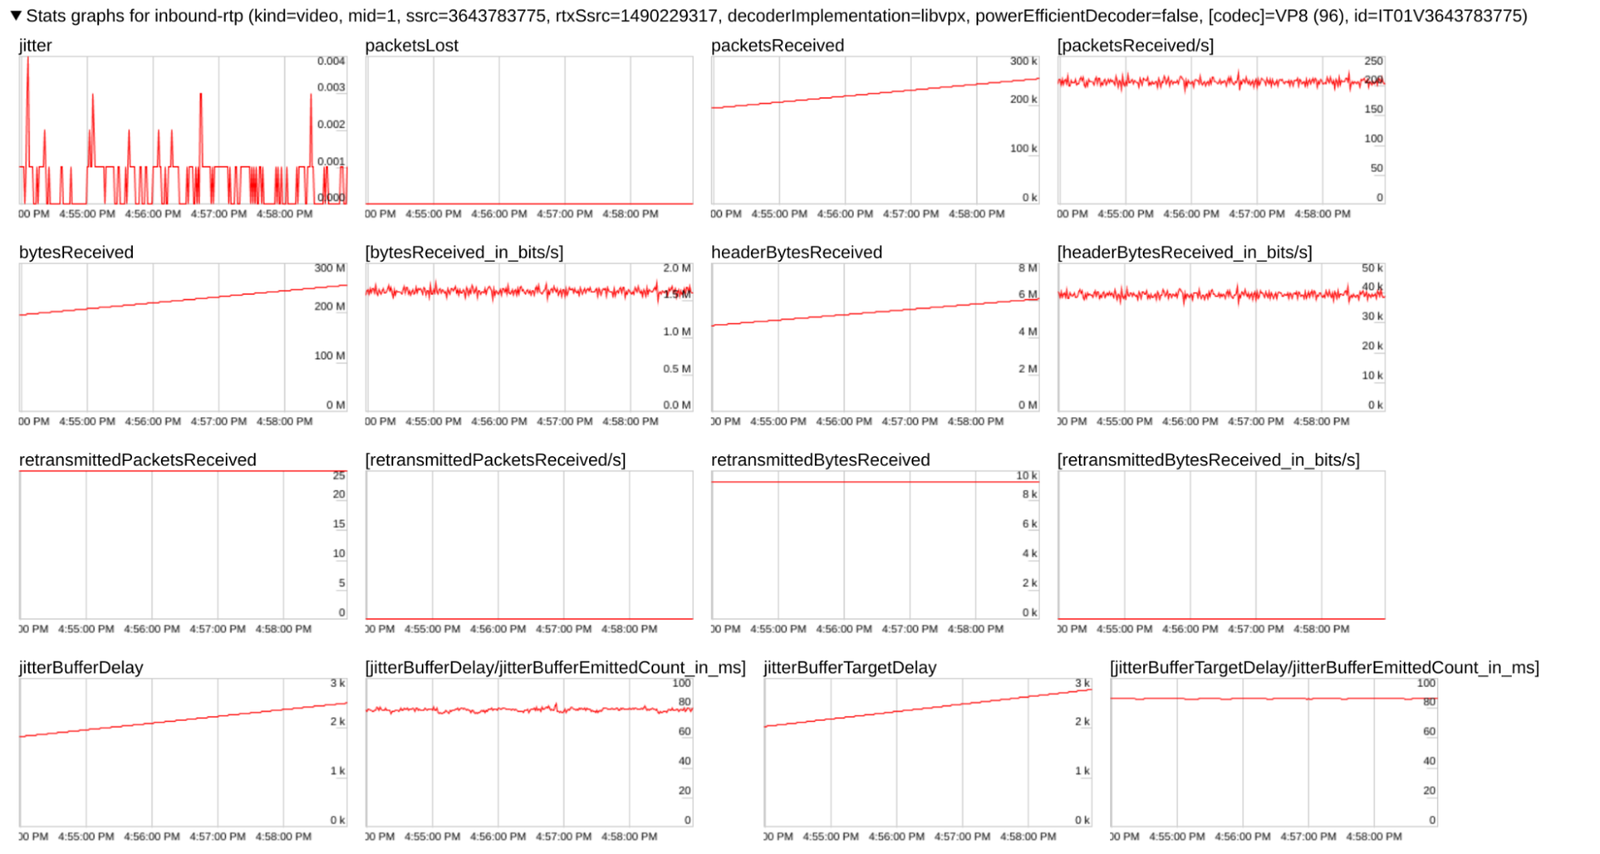
Stats & Metrics Graphs
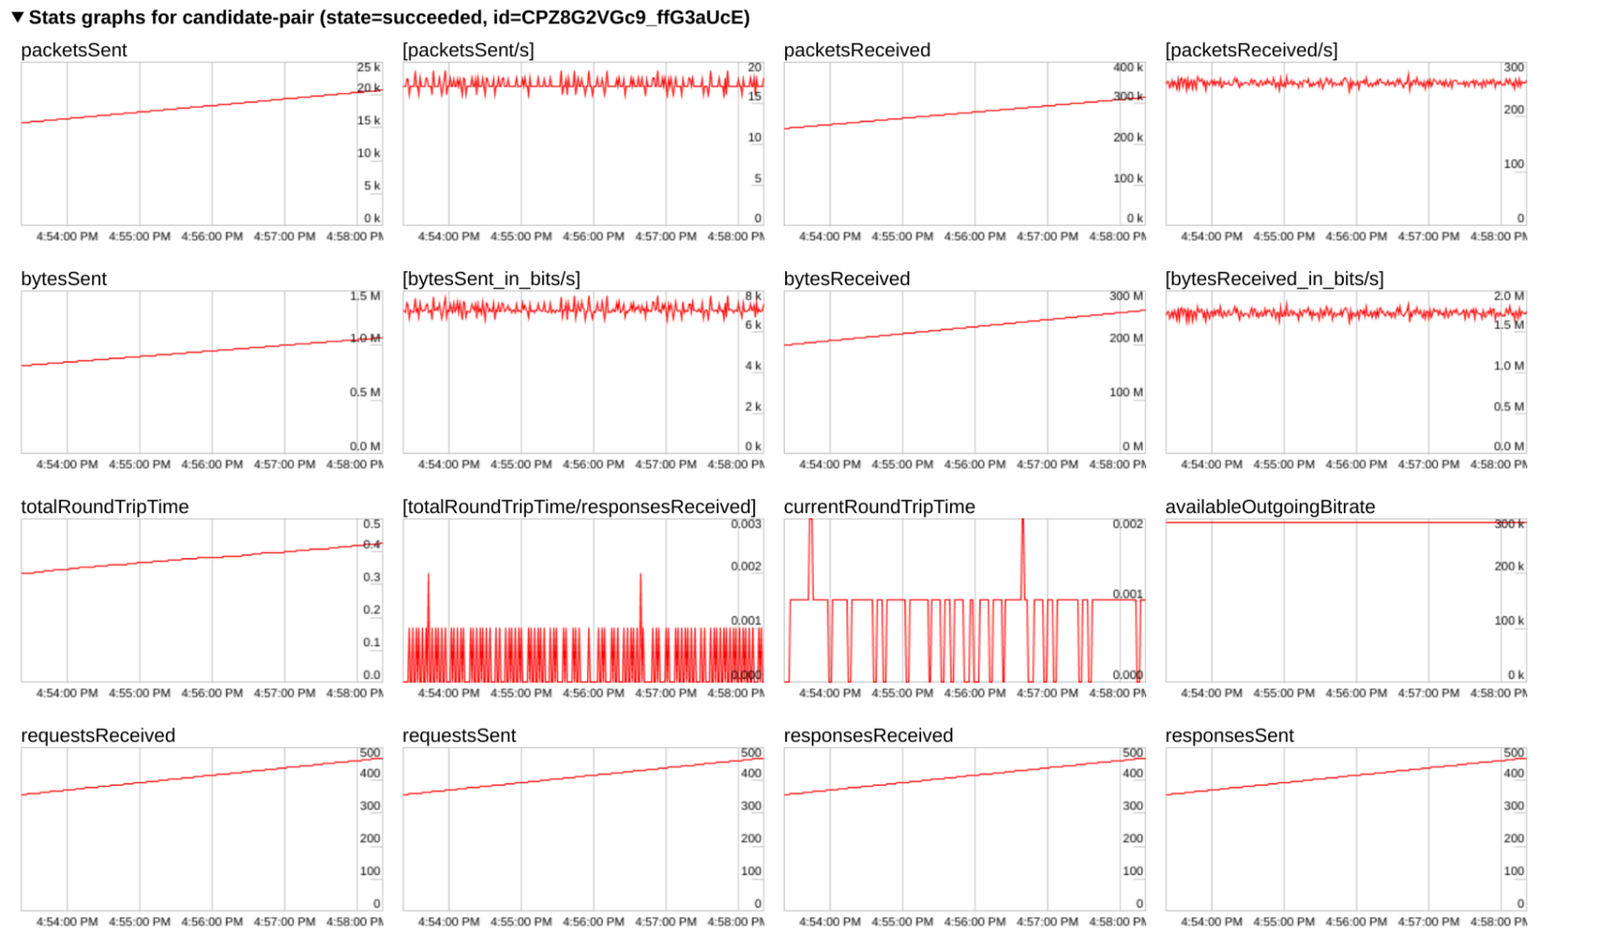
While reports are cumulative and may be difficult to interpret, graphs, which are visual representations of these stats and metrics over time, are valuable tools that provide insights into application behavior and trends.
For instance, you can see the information for the connection between the pairs by expanding on the candidate-pair graphs.
The same applies for the rest of the reports, such as the one for video received by the peer.
When Not to Use webrtc-internals
The above exercise allowed us to understand that this sample application consists of two peers in the same device, where one sends media and the other receives it. It also gave us an in-depth understanding of all the events that took to perform such a connection, from the calls to underlying WebRTC APIs, to the metrics and behavior of the connection and media transportation.
This method is useful for troubleshooting, but it requires opening the tab in advance to access the information. This may be feasible for development, but it’s not a practical solution for production environments. End users are unlikely to be able to go through this process and provide the information to developers. Although it’s possible to export and share a dump, a different approach is recommended.
Instead, applications need their own internal system to track client events and connection metrics, sending this data to a centralized store. This gives developers insight into how their application behaves in real-world scenarios, without needing users to open and share webrtc-internals dumps.
For instance, the majority of CPaaS providers integrate these mechanisms into their SDKs and present the data through user-friendly dashboards and reports. Application developers can leverage these tools to troubleshoot their real-time communication applications if they are utilizing the services of such providers.
Mastering WebRTC Troubleshooting
The webrtc-internals tab provides invaluable, real-time insights into the inner workings of WebRTC applications. This level of visibility is essential for effective debugging and troubleshooting of WebRTC issues during development.
While webrtc-internals is a powerful tool for developers, relying on it in production scenarios is impractical. Therefore, implementing robust client-side event tracing and getStats collection mechanisms within the application itself is crucial for monitoring and debugging in real-world deployments.
Mastering WebRTC troubleshooting can be challenging. Let the experts at WebRTC.ventures help you identify and resolve issues quickly and efficiently. Contact us today for a comprehensive application assessment and ongoing managed services. Let’s make it live!


