Load testing is a non-functional type of testing used to evaluate the performance of a software product under an expected load. It lets us determine how the software behaves under specific circumstances, helping the developers to improve the stability of the infrastructure.
One of the main reasons load testing is needed is to ensure that applications are able to handle a lot of user traffic. It helps identify network delays between the client and servers. Combined with monitoring tools, load testing provides useful insights about the hardware and server configurations when it comes to identifying memory limitations, network bottlenecks, etc.
When and How To Implement Load Testing
It is recommended to start thinking about load testing once the software is in a stable functional state.
The ideal way to perform load testing on your software application is to use tools specifically designed for this purpose. These tools provide several options to customize the tests and help build load scripts according to your app’s specific needs and requirements.
Load testing tools dedicated to test WebRTC services offer the ability to fake media feeds during the test execution which enables the capacity of testing the video components. Two great tools used to load test WebRTC applications, in particular, are TestRTC and Loadero. For this post, we will explore Loadero and its functionalities.
Configuring the Project and Building the Test Scripts
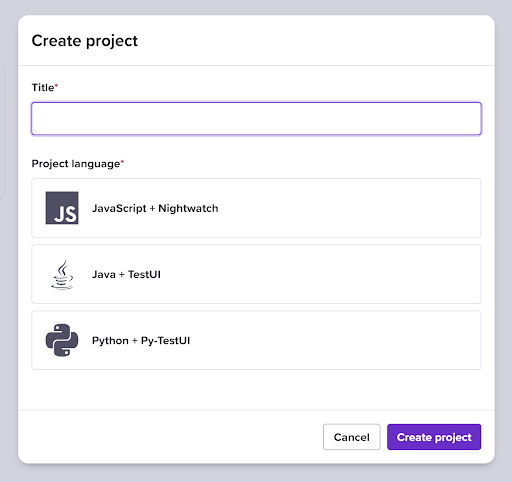
All you need to work with Loadero is access to the Internet and a web browser such as Google Chrome. First, you will want to create a Loadero account. Once logged in, you’ll be directed to the projects page. Here, you can create a new project to get started.
Loadero lets you choose between three programming languages when creating a project: JavaScript + Nightwatch, Java + TestUI, and Python + Py-TestUI. For this project, JavaScript + Nightwatch was chosen.
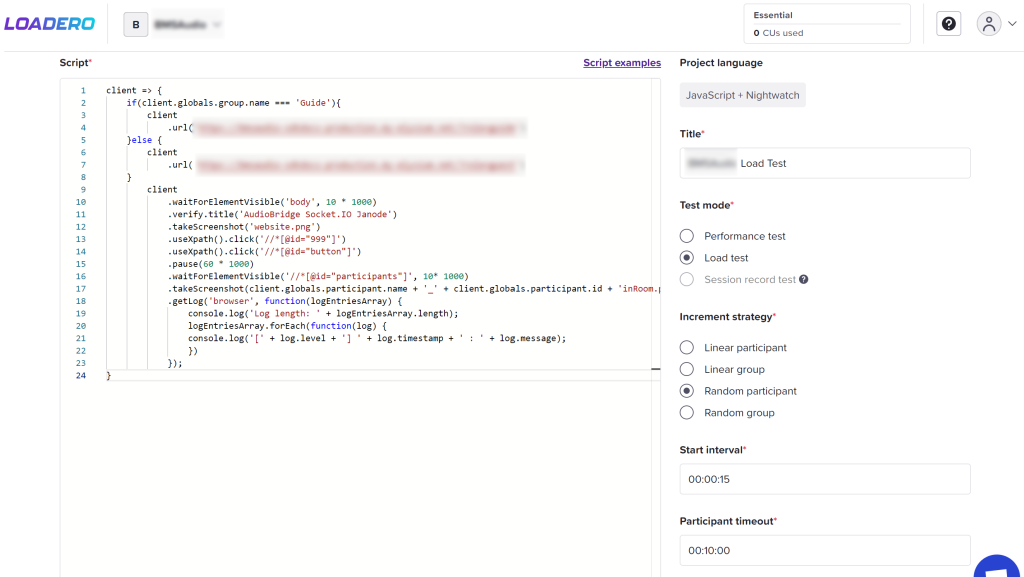
After creating the project, we can start writing the tests. The first steps would be building our script and configuring the parameters for our test. The parameters are: the test mode, the increment strategy, the start interval, and the participant timeout.
Loadero also offers three different test modes: performance test, load test, and session record test. In our case, we chose the load testing mode.
The increment strategy is a required setting for the test script. It specifies the way in which the participants will join when beginning the test execution. The two strategies that were mostly used in our tests were linear participant and random participant. As the option suggests, linear participant is used whenever it is needed for the participants in the test to join in a linear sequence. The random participant strategy is used whenever we want to simulate a real scenario where different participants would join the test in a random sequence.
The start interval describes the total amount of time in which all participants start their tests and access the service. It is modified throughout the tests depending on the number of participants. The aim is to always have steady traffic joining the test. In our case, at least two users join per second. The delay between participants depends on how long of a start interval has been set, as well as on the increment strategy chosen.
Finally, participant timeout specifies the time limit after which the test will be terminated for a test participant. With those parameters chosen and a script added, the load test script has been built in Loadero.
Creating Test Groups
Now the test has been built, but the participants still need to be configured. This is where Loadero lets you create test groups.

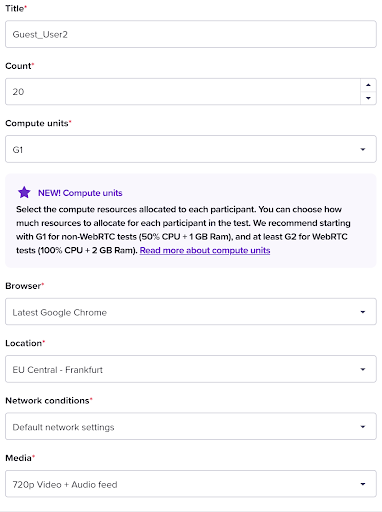
We can create as many groups as we want. Each group has a count parameter. The count parameter is the number of identical copies of the specific group to be added to the test.
Each copy will contain exactly the same participant configurations. For example, if we increase the count to two and the number of participants per group is set to 45, then we’d have 90 participants in the test. Once the group is created, we can start configuring participants in it. When creating a participant, we can configure different parameters for it, as well.
Computer Units allow specifying the amount of machine resources available for a single participant. It’s a way for Loadero to set the amount of resources used for every participant. This parameter will depend on the complexity of the test script and the application itself.
In the browser parameter, we can set the browser from where the participant will be joining the test, such as Google Chrome, Mozilla Firefox, Safari, etc, including different versions of them.
The location parameter lets us set from where the participant will be accessing the test. There are several options that include Frankfurt in Europe, Ohio in the US, Seoul in Asia, plus others.
Another parameter is the network conditions. This lets you select the type of network that the participant will be simulating. Multiple options are available, including 3G, 4G or even simulate other network limitations like a percentage of packet loss.
Last but not least, the media parameter lets you choose between several options to fake media feeds during the test.
With all of these configured, we can now run our tests.
Analyzing the Results
Now let’s take a look at the results Loadero provides us. There are a couple of views.
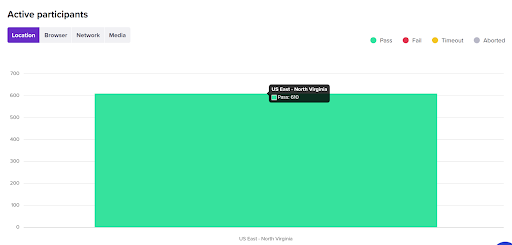
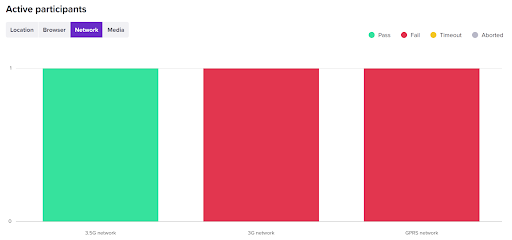
One is for the active participants that can be changed by the following attributes: location, browser, network, or media. This view shows the participants that pass, fail, timeout or are aborted.
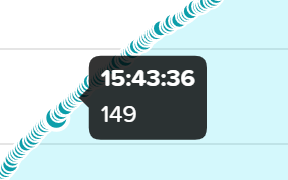
It also shows another view titled “Load” in which one can see the rate at which participants joined the test. This helps to know if the participants are joining the test at a considerable rate.
The highest load we performed was for 610 participants that joined at an approximate rate of 2 participants per second with a random join strategy. If the rate would’ve been too big, the start interval setting in the project would need to be changed.
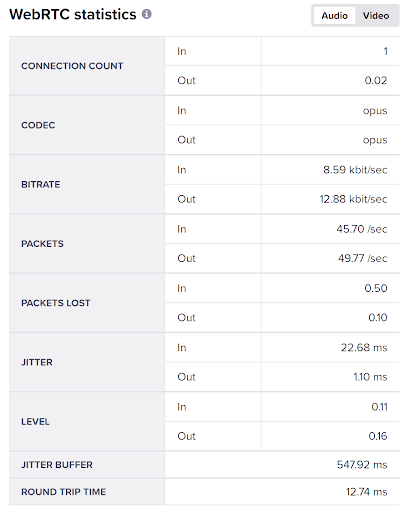
Loadero also provides WebRTC statistics. For this project, only audio was used therefore the stats it provides regarding audio are: connection count, codec, bitrate, packets, packets lost, jitter, level, jitter buffer, and round trip time. These statistics can be seen in a table at the results page.
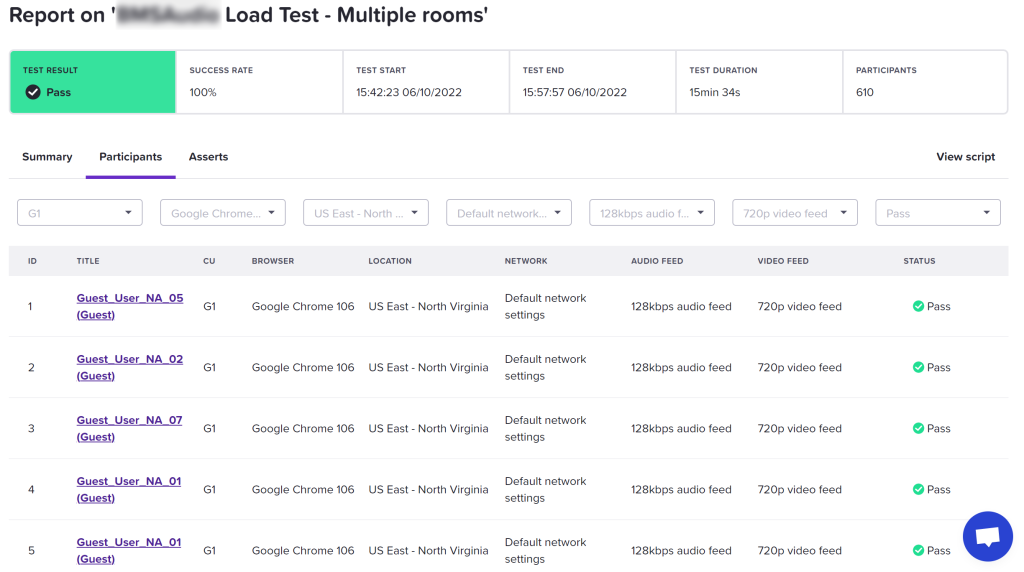
The report also lets you view results per participant. It lists the participants and their attributes with a status in the last column. You can click on any participant to view their individual statistics during the session. It also has sections to check for logs if added in the test script, artifacts such as screenshots and more WebRTC statistics in detail.
Participants with different types of network were used to identify the minimum required for a user to be able to use the application successfully. The application required at least a user with a 3.5G network connection or more.
For latency, participants from different locations were configured. The servers for the application were based in the US and participants from the US, EU, and Asia were configured. The average latency for a participant in the US was 27ms, for a participant in EU was 108ms, and for a participant in Asia was 204ms. These load tests also helped monitor the CPU usage for our servers in AWS.
The load tests built with Loadero gave us great insight on the application’s performance. After analyzing the results, we made changes in the backend and server configurations to improve their performance.
Thanks to the actions taken as a result of the tests, we mitigated risk by improving the infrastructure.
At WebRTC.ventures, we attach great importance to load testing in our development cycle and for our testing-only clients. Ensuring excellent quality in everything we do is part of what makes us unique as testing experts. If you are interested in knowing more about what our testing services can offer to your business, contact us today!

