
Client-side monitoring is a crucial task in the development of any real-time communication application. In this post, we emphasize the importance of monitoring for WebRTC applications, highlighting its role in identifying and troubleshooting user-side issues.
What is Monitoring?
Sometimes overlooked in the development of web applications, monitoring is a vital task alongside testing, especially in WebRTC applications. It aids in identifying and troubleshooting user-side issues that can disrupt meetings and cause poor media quality.
When considering WebRTC monitoring, it’s common to focus on metrics like packet loss or mean opinion scores. These metrics, while important, need to be supplemented by additional data related to devices, media servers, telephony traffic and available bitrate. Most importantly, monitoring should primarily focus on the client.
Particularly, attention should be paid to monitoring two things: events that happen during a call, and browser metrics.
Monitoring Events
The log of events occurring during a call provides insights into the user’s journey when connecting to your application. This includes accessing media devices, preparing media, creating local offers, exchanging ICE candidates, and other relevant actions facilitating user communication.
This visibility aids in identifying three key aspects:
- When a user begins to experience issues,
- The application’s activity at that moment,
- And quite importantly, what you can do to solve it.
Monitoring Browser Metrics
In addition to event logs, understanding statistics about actions performed to establish connections is essential. These statistics, known as metrics, can be obtained from the browser using the WebRTC’s Statistics API.
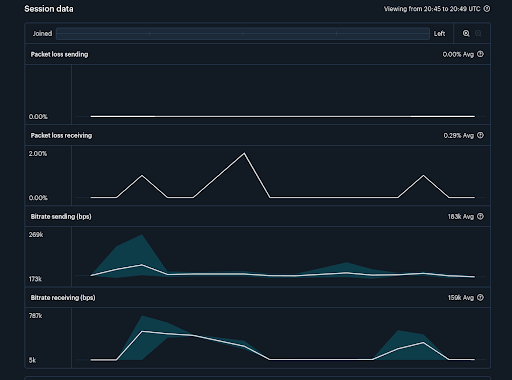
We already mentioned one important metric: packet loss. Let’s add another one to the count: bitrate.
- Packet loss is the depiction of how much information–in the shape of video, audio and any data sent through WebRTC–is lost before reaching its destination. On its own, having a low value of packet loss doesn’t necessarily mean a good connection, and the opposite doesn’t necessarily mean a bad one either.
- Bitrate indicates the rate at which media is sent through the network. It is limited by the amount of bandwidth available in the user network.
For both metrics, you’re interested in unusual but consistent values. For instance: high spikes of packet loss might indicate that the user has a bad connection or his/her network is congested; high values of bitrate paired with bad video quality might be a sign that the device is not able to process the amount of media that it is receiving.
Identity bottlenecks and pain points in your communications application
Effective monitoring in WebRTC applications enhances reliability and user satisfaction. Analyzing event logs and browser metrics provides crucial insights into user experiences. Proactive monitoring enables quick diagnosis of issues, from device malfunctions to network problems.
Most CPaaS providers offer dashboards for monitoring WebRTC application performance. Our partner, Daily, integrates this with account management, allowing convenient tracking of both aspects in one place. “How to Monitor Your Real-Time Communication Application Built With Daily” will be the subject of my next post.
Need help monitoring your WebRTC application? Call on our expert WebRTC team!