In a prior post, I spoke about the importance of client-side monitoring your real-time application and introduced you to some of the more important elements, like events and browser metrics such as packet loss and bitrate. If your application is built with a CPaaS, most providers offer dashboards where customers monitor the performance of their WebRTC applications.
Daily, a WebRTC.ventures CPaaS partner, stands out for its simple, yet powerful, approach for providing real-time communication features for web and mobile applications. In addition to a robust platform, it also provides great tools to monitor your application, giving you the visibility to ensure smooth user experiences and troubleshoot potential disruptions.
Let’s explore how you can monitor your WebRTC application built with Daily.
Daily’s Monitoring Dashboard
Daily applications organize calls around the concept of Rooms. A room is a logical space where participants can connect and exchange media. A Room can host many sessions, one at a time. When a participant joins a room using the unique URL assigned to it, it automatically creates a new session, or joins the existing one if available.
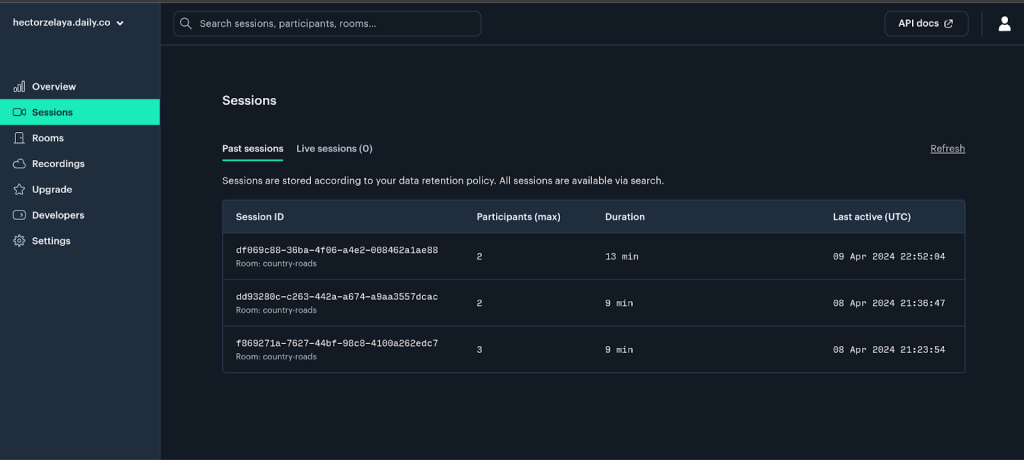
When a participant joins a session, the Daily API starts gathering information about them. This includes the log of events and also metrics about the connection. All of this information is available in the Daily Dashboard under the Session screen on the left. After clicking it, you can see the list of sessions.
Clicking on a session reveals general information about it, including the list of participants. Note that if the same user has joined the session multiple times, they will appear as multiple participants.
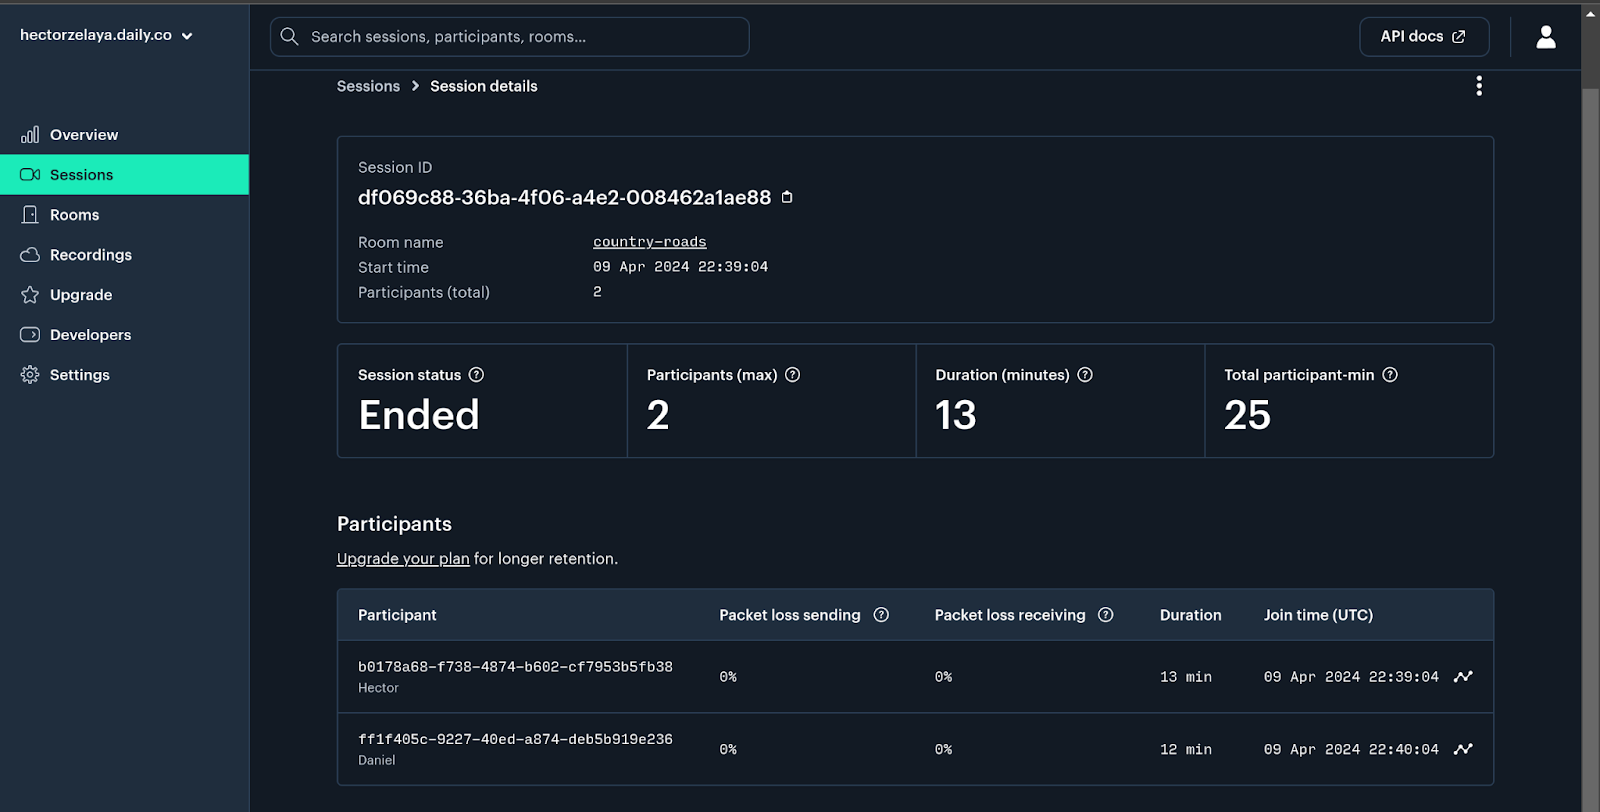
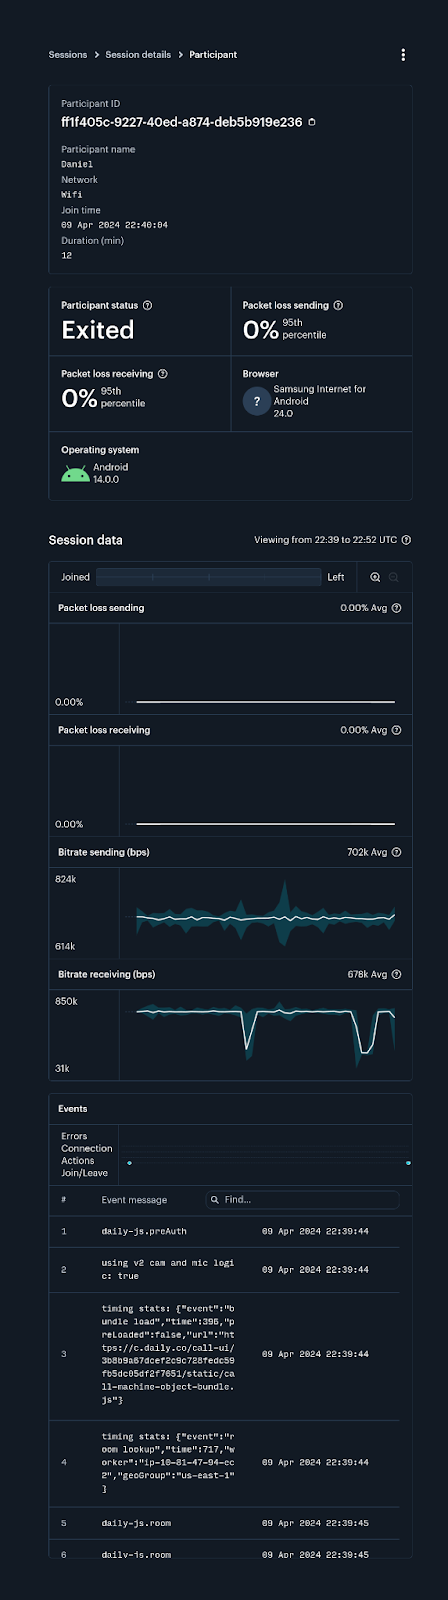
And here’s the interesting part: you can select each participant and see their own set of events and metrics.
Let’s look at some examples of how you can debug actual issues using this information.
Example 1: Malfunctioning Media Devices
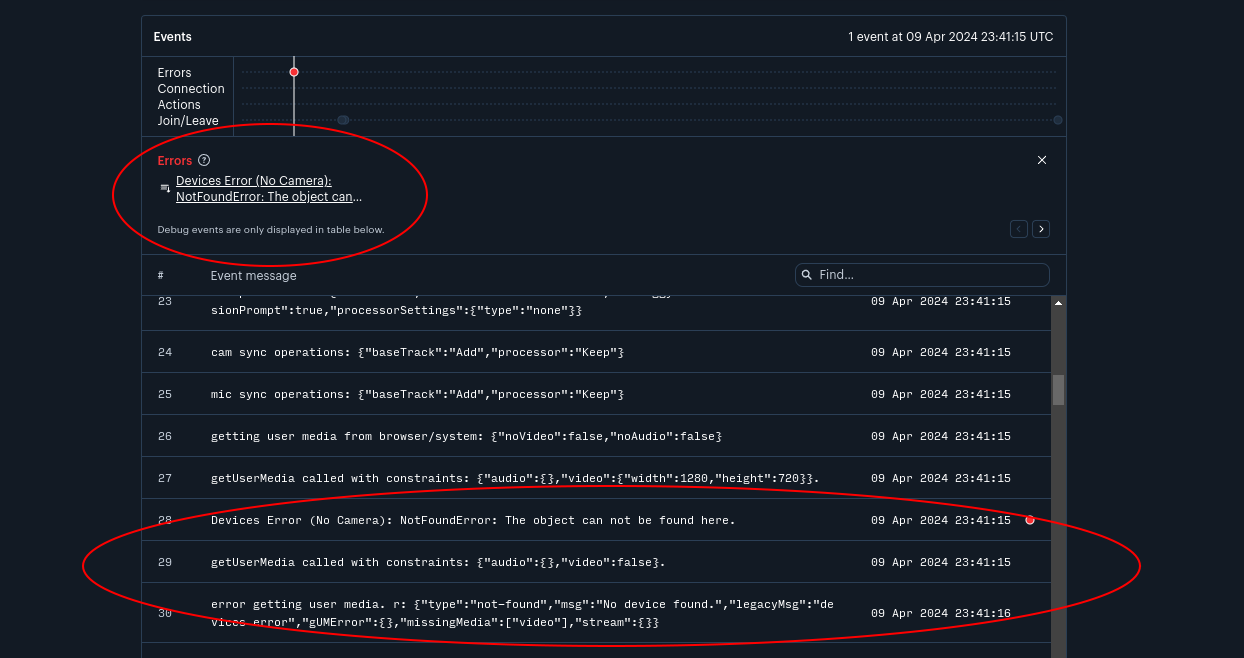
A user complains about not being able to turn his camera in the application. A quick look at the event log shows that the application was not able to find any camera connected to the device, indicating that either the user has a faulty camera or they are missing the drivers for it to be recognized.
Example 2: Bad Network Connection
A user is complaining about low video quality and high latency. By going into the dashboard, we can see that the issue is due to the user running on a slow connection.
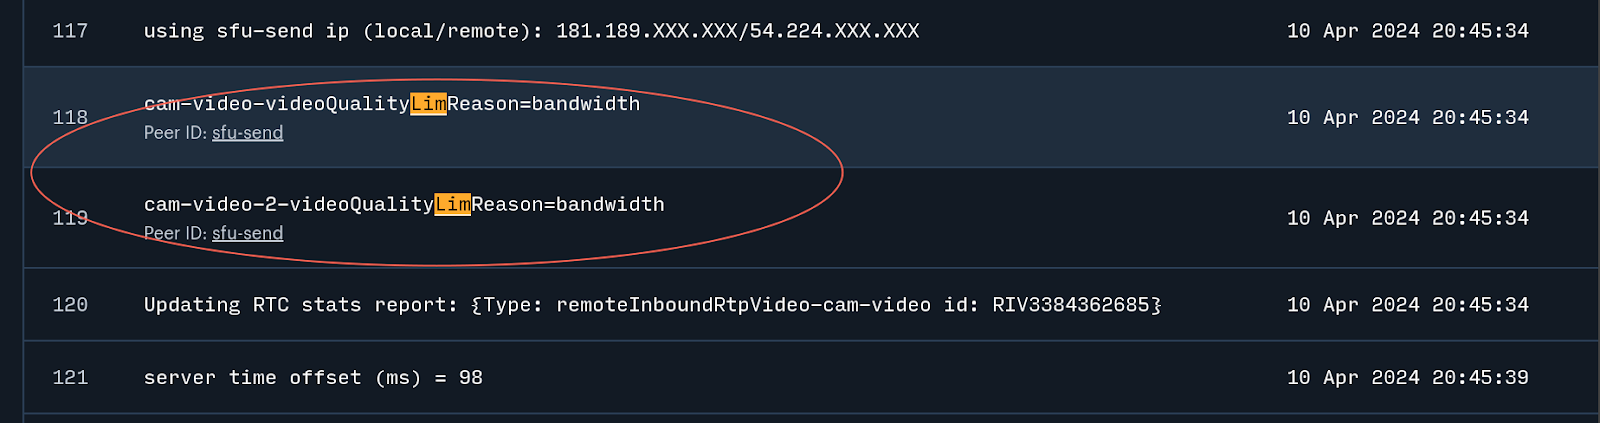
We know this thanks to the videoQualityLimReason log event, which tells us that the browser has limited the quality of the video sent. In the below screenshot, we see that such an event appears in the user log indicating that the video quality is limited due to bandwidth reasons. This indicates that there is a network connection issue on the user side.
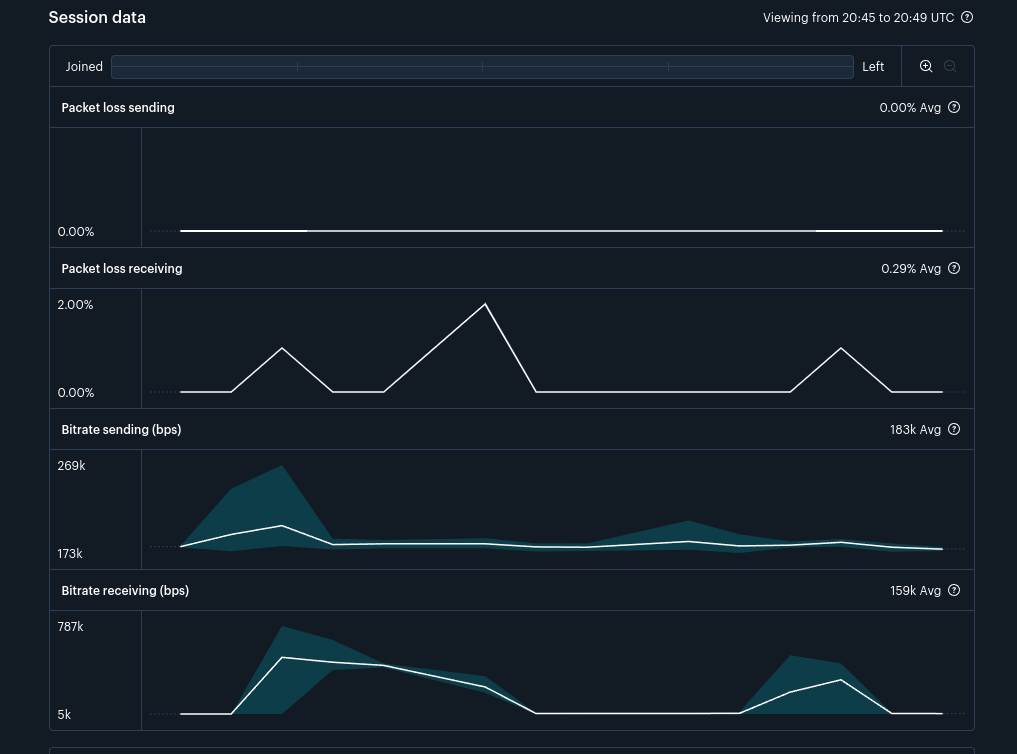
The above is reinforced with the data from packet loss and bitrate metrics. You can see how there are multiple spikes of packet loss and the bitrate considerably decreased, indicating that the network might be too congested.
Identity bottlenecks and pain points in your application
For WebRTC applications, effective monitoring tools like the ones provided by Daily enhance reliability and user satisfaction. By analyzing event logs and browser metrics, developers gain crucial insights into user experiences. Proactive monitoring enables quick diagnosis of issues, from device malfunctions to network problems.
If you’re looking into building powerful real-time communication applications with strong monitoring traits, our team has you covered! Our skilled staff of engineers can leverage fully-featured APIs like the ones provided by Daily to add the capabilities your application needs. Contact us today and let’s make it live!


