In my previous blog post, we saw how the SFU (single forwarding unit) saves on the network congestion and client side power consumption by using forwarding via a centralized server. While there are obvious advantages to SFU, it is worth noting how it performs with regard to energy efficiency and other factors in comparison to other established video conference topologies like Mesh, Mixed (MCU), and hybrid (MCU + streaming server).
| Mesh | Mixer (MCU) | Single Forwarding (SFU) | Hybrid ( MCU + streaming server) | |
| Client side power consumption | Highest | Lowest | Medium | Low |
| Server side power consumption | Lowest | Highest | Medium | High |
| Network Congestion | Highest | Lowest | Medium | Low |
| Quality | Medium (dependent on each peer’s bandwidth) | Low for heterogeneous sources and codecs | Medium | HIgh ( passive listeners may experience a small delay in incoming stream) |
| Scalability | Not good for >10 people in practical applications | High Large media server can hosts larger conferences | Medium Needs to scale out with cascading setup | Highest Requires dynamic resource allocation of media servers |
| Cost to communication service provider | Lowest | High Media Server performs active decoding, resampling, encoding, etc | Low Server acts a media proxy, forwarding streams between multipoints. | Medium Server identifies active users for MCU and passive users for streaming server. |
Let us dive deeper to analyze the CPU consumption, as well as carbon footprint of the most popular topologies from the table above.
Compute Pressure API
For the experiments to record the CPU load and energy efficiency of the meshed, mixed, and single forwarding RTP topologies, I have used the Compute Pressure API[1]. To activate, go to chrome://flags/ and enable #enable-experimental-web-platform-features.

Protip: It worked wonders for the study to use Chrome Beta and the experimental feature of Compute API to record results in a controlled test environment. It would have been largely unfeasible to do so on the everyday stable Chrome browser due to pre-recorded background tasks, bookmarks, and other account-related notifications. These activities may have hindered predicting the CPU utilization and clock speed values. Chrome Beta with fake video audio sources did well for the study.
One can fetch results from https://googlechrome.github.io/samples/compute-pressure/index.html to see the CPU utilization under normal conditions.
Idle state shows the lowest CPU utilization and very low CPU speed.

Signaling (Registration): Once SIP registration and presence begins, the CPU activity increases.

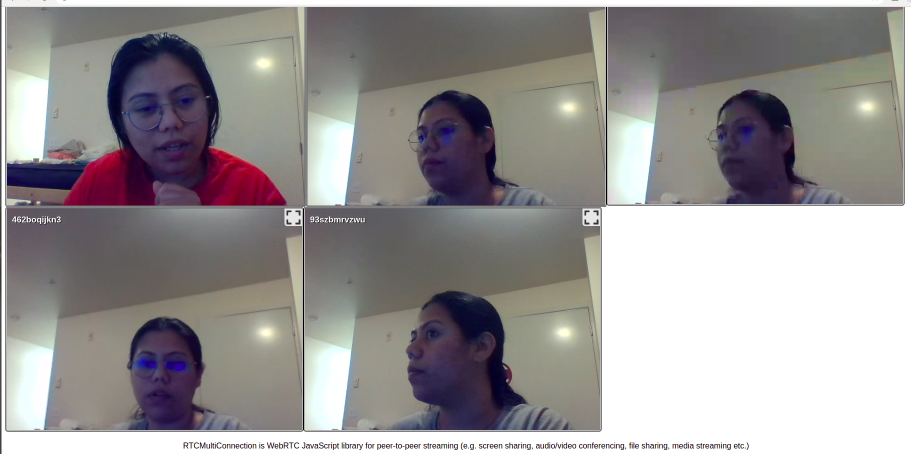
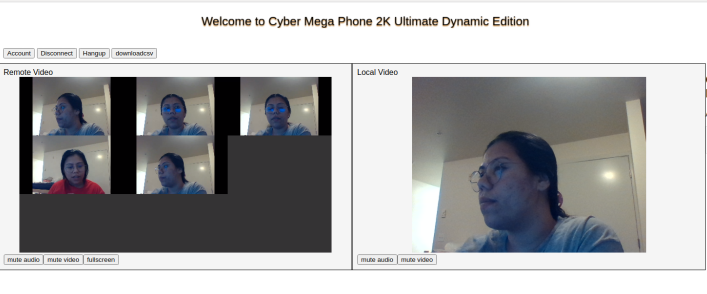
P2P / Mesh mode CPU utilization: The consumption under peer to peer mode video for a two-party call is shown below. Note the increase in CPU utilization and also the increase in CPU speed to satisfy the demand in computing power.

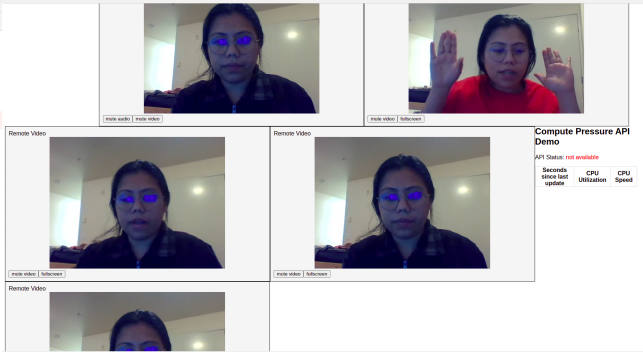
SFU CPU utilization: Although SFU is designed for multi-party calls, in this screenshot I analyze it against a P2P two-party call. I used the centralized SFU setup of Asterisk (shared in my previous post ) and found the results to be higher than P2P. However in large scale participant count, SFU performs better than P2P-based mesh media streaming topology, depicted in next sections of this post.

MCU CPU utilization: The utilization started off with medium usage but soon picked up SFU-like stats as more participants join the conference. However among SFU and MCU setups, the quality of MCU far exceeded the SFU for audio video sync and overall quality.
Chrome beta and fake media
To create a controlled test environment, I used a fake audio video stream to test all setups using raw YUV4Mpeg format which stores a sequence of uncompressed YCbCr images that make up the video frame by frame. A quick reference on fake audio video can be found on testRTC or Tsahi Levent-Levi’s excellent Advanced WebRTC Architecture course.
Fake Video Stream
ffmpeg -f v4l2 -i /dev/video0 -t 60 videosample.mp4

ffmpeg -i videosample.mp4 -pix_fmt yuv420p rawvideosample.y4m

sed -i '0,/c420mpeg2/s//C420/' *.y4m
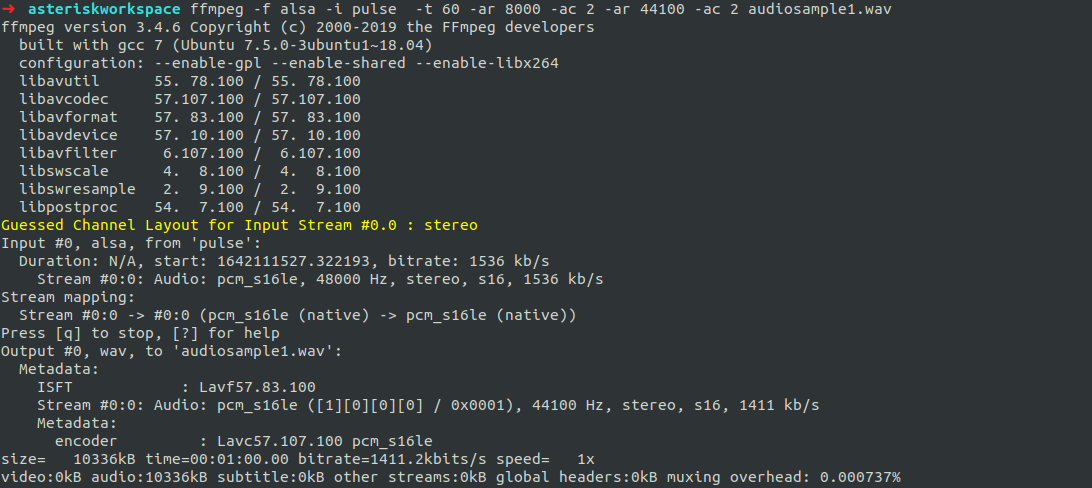
Fake Audio Stream
ffmpeg -f alsa -i pulse -t 60 -ar 8000 -ac 2 -ar 44100 -ac 2 audiosample1.wav
Using with Chrome
chrome --user-fake-device-for-media-stream --use-file-for-fake-video-capture=rawvideosample.y4m --use-file-for-fake-audio-capture=sound.pcm
Carbon Footprint and CPU utilization of Video Conferencing Topologies
From analyzing the three topologies, one could see that almost all of them start with low CPU utilization and speed, but gradually reach full utilization and speed as more participants join in.
In terms of quality, I felt MCU was the most stable. However, I could not control any one stream in particular such as mute unmute from remote.
SFU was stable, but intermittently experienced lag.
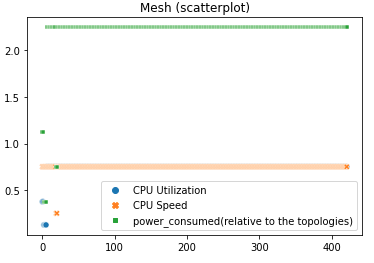
The mesh setup was clearly the highest consumer of power and provided the worst possible experience, with many videos blacking out and freezing for long durations.
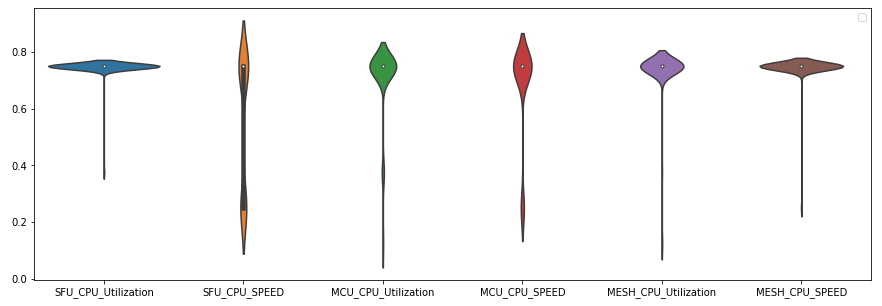
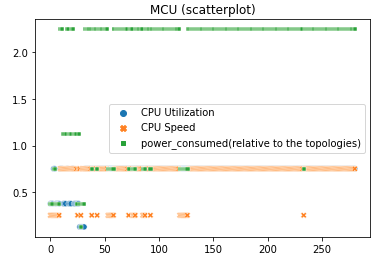
Here, CPU utilization relates to total use across all CPU cores while CPU speed related to how fast was the CPU frequency at that moment. This frequency of CPU speed may scale up depending on the heavy load (turbo mode) by varying voltage and consequently will dissipate more heat.
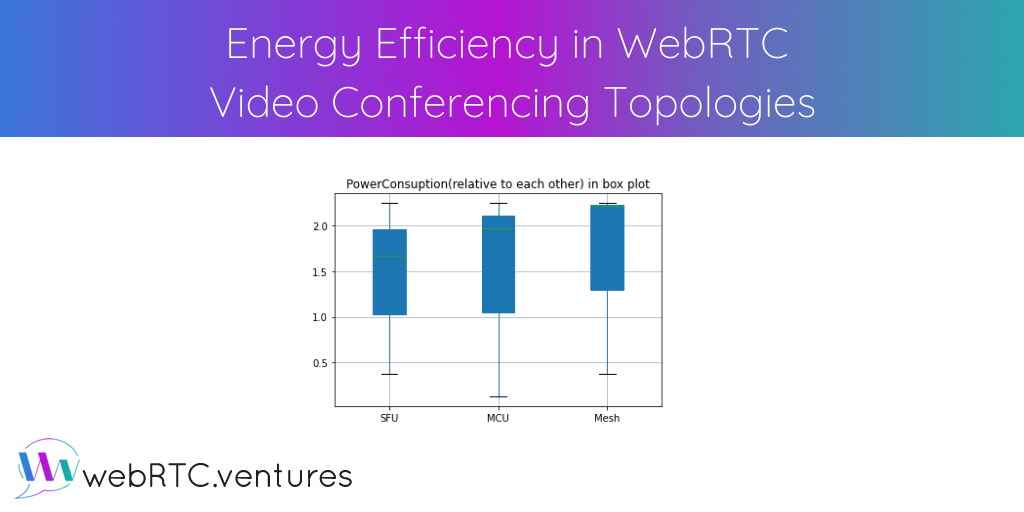
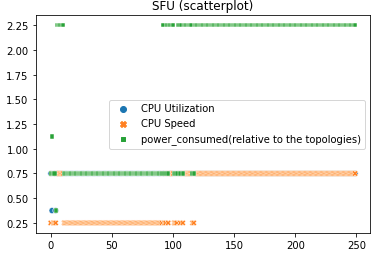
Inter-comparision on relative power consumption (among) the topologies:
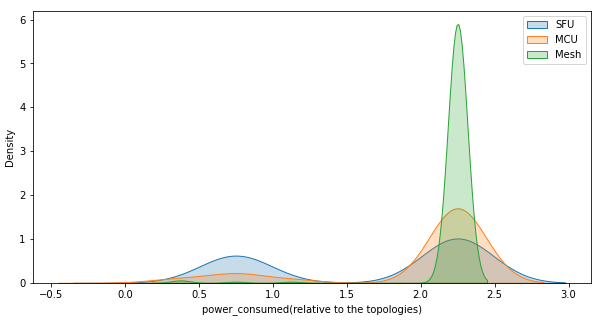
For anyone familiar with the internals of the system, we could possibly use power consumption from formula p=S+f∗C∗v² , where p = power consumption, S is the static power consumption of the chip, C is the capacitance (constant for that design of processor), f is frequency, and v is the supply voltage.
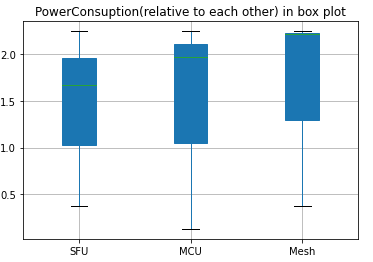
Given my system make and model (Intel® Core™ i7-7500U CPU @ 2.70GHz × 4), the thermal design power or watts dissipated is 65W, which could have given me a near approximate power utilization in realtime from video conference. However, I could not find a reliable formula to calculate dynamic power from system’s browser consumption. Hence, the graphs are for inter-comparison. The individual stats of one particular topology should not be used independently.
About the Author: Altanai Bisht
Here at WebRTC.ventures, we pride ourselves on offering our clients the opportunity to work with extremely bright developers, like Altanai. Don’t trust your custom video solution to just anyone. Trust the experts!